Interacting with Identity Graph
When you have an identity graph open, you can:
- Use the graph tools to find and view a specific set of data.
- Interact with access objects and their nodes to gain further insights.
- Use widgets to filter and visualize data from different perspectives.
Using Graph Tools
You can use the following tools to manipulate the graph to find a specific dataset:
| Action | Description |
|---|---|
| Zoom in and out | To zoom in or out of the graph, use the mouse wheel. Zooming into a graph allows you to view a specific area for a more thorough examination of the relationships, view details, and pinpoint data points. To zoom in on the graph so all its nodes are visible on the screen, select Zoom to Fit. To realign the graph to the center of the Identity Graph interface, select Center Graph. |
| Pan | Drag the background of the graph to move it in any direction without changing its zoom level. After zooming in, pan to navigate and inspect specific areas to analyze the data more closely. |
| Drag | The identity graph or individual nodes can be dragged to a new position on the graph. Drag the identity graph To drag a graph and view certain parts of the graph, especially if you have zoomed in on the graph, left-click anywhere on the graph, not a node, and move the mouse to reposition the entire graph. Drag an individual node Drag an individual node to visually rearrange, organize complex relationships, and create a more intuitive layout to enhance your interaction and exploration. Left-click and hold, then move the mouse to reposition the node on the graph. |
| Expand | To expand a node and reveal its hidden connections, select the Plus icon in the node. Expanding nodes provides a better understanding of the relationships, allowing you to explore the graph more deeply. To expand all nodes in all the layers that have a Plus, select Expand All Objects To expand only the visible nodes that have a Plus, select the Expand Next Layer of Objects. |
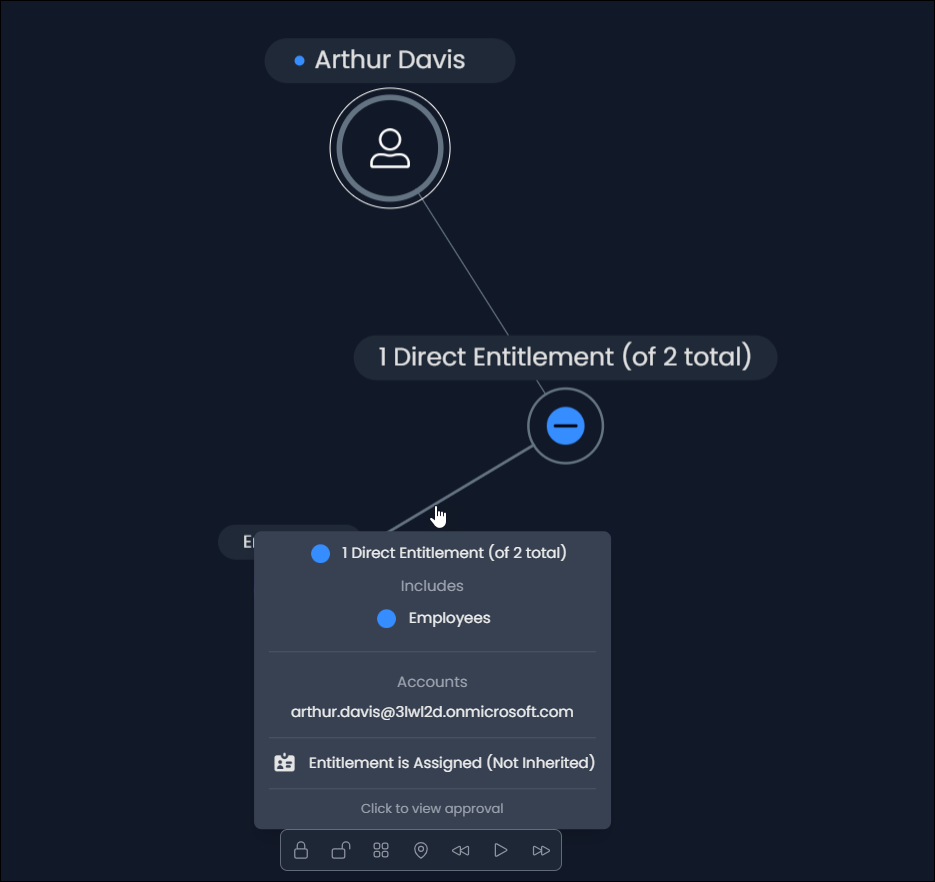
| Collapse | To collapse a node and hide its connections, select the Minus in the node. Collapsing nodes helps organize the graphs and simplify the visual display, allowing you to focus on other areas of the graph. To hide all connections that have a Minus, select the Collapse All Objects. |
| Locking Nodes | The locked node does not move when you manipulate the graph. To lock a single node, right-click the node. A blue ring is present around the node when selected. Then select Lock node. A purple ring is present around the node when locked. |
| Unlocking Nodes | The unlocked node moves when you move the graph. To unlock a node, select a node with a purple ring, right-click, and select Unlock node. To unlock all locked nodes, select the Unlock All Nodes icon. |
| Graph and Table toggle | Toggle between the graph and table view when viewing data. |
Viewing Access Object Details
To view additional details about each node:
-
Node label - Hovering over an identity shows the labels of the identity and its access items. Hovering over an access item highlights only its connections and their labels.
-
Access Object Details window - Displays information from the access object details available in Identity Security Cloud. To open, right-click an access object and select View Details. The available actions are dependent on the access object type.
Select the dropdown arrow for each heading to view the details.Information relating to identities
Section Description Details View additional information about an identity.
Note: A lock toggle is to the right of the access object in the Identity Details window. If enabled, the access object's details remain in the window even when the graph changes.Attributes Lists additional attributes linked to the identity. Accounts View accounts linked to the identity.
You can change the status of an account on a connected source by selecting Enabled or Disabled from the dropdown list.
Note: A warning icon is displayed for dormant accounts. Dormant accounts are accounts that have either never been used or have had no activity within the past 30 days. Select the View Details icon to view more information about the account, including the date the account was last active.
Events View a list of identity events. Information relating to access items
Section Description Details View information about the access object. Source View source and account attribute details.
Interacting with Nodes
You can right-click on a node to open a list of actions. The available actions are dependent on the access object type.
| Action | Description |
|---|---|
| View Graph | Opens the identity graph for the node. Opening another identity graph causes you to lose any updates made to the open graph. To save the identity graph:
|
| View Details | Displays the access object's Details panel, providing configuration details. Depending on the access object, the panel may also include attributes, source, account, and event information. |
| Open in ISC | Opens the access object in Identity Security Cloud within a new browser tab. The Identity Graph browser tab remains open. |
| Add to Explorer List | Adds the access object to the Explorer. Note: One hundred access objects can be added to the Explorer list. |
| Remove from Explorer list | Removes the access object from the Explorer. If you remove a root node from the explorer, the graph is closed. |
| Lock Node | Locks the position of the node to its current position on the graph, preventing it from moving when you manipulate the graph. |
| Unlock Node | Unlocks the position of the node, enabling it to move when you manipulate the graph. |
| Filter by this Node | Displays the relationships for the access object. |
| Expand all children | Expands all nested entitlement hierarchy nodes contained within or inherited from an access item, including multiple levels with parent and child entitlements. |
| Expand all parents | Expands all assigned entitlements directly associated with an identity, granted via an access profile, or roles connected to the identity. |
| Set Lifecycle State | Sets a human identity’s Lifecycle State directly from the graph. Hover over Set Lifecycle State to select a lifecycle state. Changes to the lifecycle states might take a few moments to be reflected within the graph. |
Comparing Identities
You can interact with an identity's node to enter Comparison mode in the Identity Graph. This mode displays two identities and their access, allowing you to compare their similarities and differences. Review this visualization to ensure that neither identity is overprovisioned or has access to inappropriate access objects.
Note
Organizations that have Machine Identity Security and Agent Identity Security can create comparisons for human and machine identities.
-
In the Identity Graph, find an identity.
-
Right-click the identity’s node and select Compare to another identity.
-
In the search bar, search for and select the identity you want to compare the primary identity to.
The names of the identities and the colors that represent them are displayed in the Explorer. Review the legend for more information about the colors used in Comparison mode.
-
In the Explorer, select an option from the Comparison options dropdown list:
- Show All - Displays both identities and their access.
- Differences Only - Displays access items that the identities do not share.
- Common Only - Displays access items that the identities share.
The identity graph will update based on your selections.
You can use predefined filters and groups to filter or group the identities and their assigned access objects. You can also create custom filters and groupings by using filter and group criteria. Any filters or groupings that have been applied to the graph will remain when you enter Comparison mode. Access objects that are included in the filter will appear faded in the identity graph if they are not part of the selected comparison option.
To export the comparison data, ensure the graph includes the required data and select the JSON Export Tools icon
 > Export graph as JSON.
To exit the comparison, select Exit Comparison from the Comparison options dropdown list and choose the identity to remain in the identity graph.
If you find an identity does not require access to an access object, you can request the access be revoked directly from the Identity Graph page.
Revoking Access
You can interact with nodes to revoke an identity's access to entitlements, access profiles, and roles.
-
Open the graph for an identity.
-
Find the node for the access you want to revoke.
-
Left-click on the line connected to the access item.
-
In the Approval History window, select Revoke Assignment.
Notes
You cannot submit access revocation requests for the following:
- Roles granted by membership criteria
-
Entitlements and access profiles granted through role membership
If removed, these access items are automatically reassigned upon nightly refresh. Refer to Automating Role Assignment for more information.
-
In the Request Revocation window, review the impact the revocation may have on other access items. For example, if you request the revocation of a parent entitlement, the child entitlements will also be revoked.
-
Enter the business justification for revoking this access and then select Revoke.
If the request doesn't require approval, the identity’s access removal is triggered. If the request requires approval, the request is sent to a reviewer. You’ll receive an email when they have approved or denied your request.
You can track the status of the revocation request in Identity Security Cloud.
Using Widgets
You can use the widgets on the left side of the page to filter, group, and change the display of data in the identity graph. The following widgets are available:
- Explorer - Save the last access object you searched for or viewed. If you leave Identity Graph, your selections are saved for your next session.
- Filters - Use predefined filters or create your own to view more granular data in the graph.
- Groups - Use a predefined group or create your own to organize access objects by shared attributes.
- Layers - Add layers to display additional information about access objects.
- Layouts - Change the display and order of nodes in the graph.
Filtering Data
You can leverage filters to view more granular data combinations. When you select a filter, the identity graph updates and presents you with the data relating to your selected filter criteria. Indicators at the top of the graph will show when the graph is being filtered.
- Select Filters to the left of the identity graph.
-
Apply a filter using one of these methods:
-
Select a predefined filter
Selecting a predefined filter updates the identity graph.
Filter Description Multiple Path Access Displays access granted to an identity from more than one access item. High Effective Privilege Access Displays access items that inherit a high privilege level from other access items. High Direct Privilege Access Displays entitlements that are assigned a high privilege level. Recently Granted Access Displays entitlements that were granted in the last 30 days. Outliers - Rare Access Displays entitlements that are assigned to less than 1% of the organization.
Note: Your organization must have the Identity Outliers feature to use this filter.Has Parent Entitlement Displays any parent entitlements that the identity is assigned. Any child entitlements the identity may have inherited are also displayed. Refer to Entitlement Hierarchy and Inheritance for more information. Cyclical Path Displays entitlements that contain a loop in their hierarchy. These entitlements are nested in a circular way, meaning that an entitlement is nested in a group that is already part of its hierarchy. -
Build your own by adding one or more filter criteria
Field Description Type Select the access object to filter on. If you select Identity, you must also select the Identity Type. Choose between Human or Machine. Attribute Select the attribute to use in this filter. The available attributes change depending on the selected Type. Operator Choose an operation to compare the attribute to the value you enter. Select Apply Filter to update the identity graph to match the filter criteria.
-
Toggle a filter and then configure additional filter criteria
Select Apply Filter to update the identity graph to match the filter criteria.
-
Note
Filter criteria are connected by AND operators and return items that have all of your search terms in the access object. A maximum of three filter criteria can be added.
Grouping Data
Group data by attribute to physically co-locate objects that have the specified attribute into the same node in the graph. This provides additional clarity across multiple identities.
- Select Groups to the left of the identity graph.
-
Apply a grouping using one of these methods:
-
Use the toggle to apply a predefined group
Selecting a predefined group updates the identity graph.
Group Description Human Identity Country Group human identities according to their country. Human Identity Department Group human identities according to their department. Entitlement Effective Privilege Group entitlements according to their effective privilege level. Entitlement Source Name Group entitlements according to their source.
Note: In Comparison mode, this option groups entitlements by the identities they are assigned to.Note
When using the predefined groups, you can only select a single toggle at a time.
-
Build your own by adding one or more group criteria
Select an access object and the attribute you want to apply as the group criteria.
Field Description Type Select the access object to group. Attribute Select the attribute to use in this group. The available attributes change depending on the selected Type. Select Apply Group to update the identity graph to match the group criteria.
Note
Group criteria are connected by AND operators, and return items that have all of your search criteria. A maximum of five group criteria can be stacked into one group.
-
Adding Layers
Add layers to reveal additional information about the node.
- Select Layers to the left of the identity graph.
-
Select one or more layers.
- Labels - When you hover over a node, the metadata is displayed for the node and its connections.
- Context - Adds color and relationships to lines.
- Names - The name of each node is visible on the graph.
The layer is applied and visible on the graph.
A green dot marks added layers, while a grey dot indicates that the layer has not been applied.
Changing Layouts
By default, the identity graph is displayed in a dynamic layout, where the root node is centered on the graph. Other available layouts include top-down and left-right.
- Select Layouts to the left of the identity graph.
-
Select the layout choice to be applied to the graph.
- Dynamic - Displays the root node centered on the graph.
- Top-down - Positions the root node at the top and displays all other nodes below.
- Left-right - Displays the root node to the left and all other nodes to the right.
Documentation Feedback
Feedback is provided as an informational resource only and does not form part of SailPoint’s official product documentation. SailPoint does not warrant or make any guarantees about the feedback (including without limitation as to its accuracy, relevance, or reliability). All feedback is subject to the terms set forth at https://developer.sailpoint.com/discuss/tos.