Administrator Tasks - Website
To administrators in charge of the File Access Manager configuration and ongoing operation, the dashboard and gives an overall view of the state of the system.
In the web client, go to Dashboard > Administrator.
The administrator dashboard features a graphic overview to assist monitoring the system. Its widgets show various system statistics for detailed analysis, including reports and drill-downs to forensics screens. You can update the widgets on the administrator dashboard either automatically or manually.
When the Update Now task finishes, the system generates a notification and displays it as a new unread notification which refreshes the dashboard.
The Administrator tab of the dashboard consists of the following widgets:
-
Data Ownership
-
Sensitive Data Exposure
-
System Health Check
-
Activity Statistics
-
Alerts in Last 7 Days
-
Active Data Classification Policies
-
Active Campaigns
-
Top Sensitive Resources by Activity
-
Top Users with Pending Tasks
Select the Update Now button to update all the widgets in the Administrator tab. Selecting Update Now starts a background task that updates tables with information for widgets, either automatically (daily) or manually. The Last Updated date to the left of the Update Now button is updated accordingly.
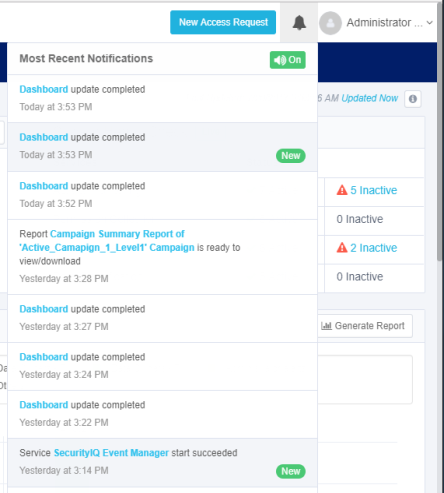
Select the bell icon to open the Most Recent notifications.
Select the most recent notification at the top of the list to update all information displayed in all widgets.
Data Ownership
The Data Ownership widget displays the number of resources with classified data that are missing an assigned data owner. This widget display the overall compliance score.
| Term | Description |
|---|---|
| Data Owner | A user who is responsible for reviewing and approving the access of users to resources. |
| Score | The score consists of a number, as follows: - A score of 0 to 5 indicates a high risk. - A score of 5.1 to 7.5 indicates a medium risk. - A score of 7.6 to 10 indicates a low risk. |
| Counter | The counter displays the number of sensitive resources missing owners. If the number of resources is one thousand or more, it is expressed in K (e.g., 10,000 displays as 10K). If the number of resources is one million or more, it is expressed in M (e.g., 10,000,000 displays as 10M). 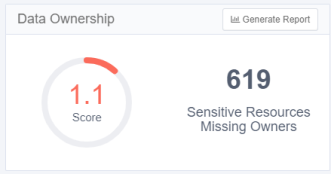 |
| Report | Select Generate Report to create a detailed resources report. When the report is generated, it can be accessed in Reports > My Reports. |
| Update Frequency | The data is updated daily, by default. |
Sensitive Data Exposure
The Sensitive Data Exposure widget displays the number of overexposed resources and the overall compliance score.
The structure of this widget is similar to that of Data Ownership.
| Term | Description |
|---|---|
| Overexposed resources | Resources containing classified data which can be accessed by a large number of users. You can configure the definition of “large number of users” in Settings > General > Overexposed Resources. |
| Report | Select Generate Report to create a detailed report listing resources and groups. When the report is generated, it can be accessed in Reports > My Reports. |
| Update frequency | The data are updated daily, by default. 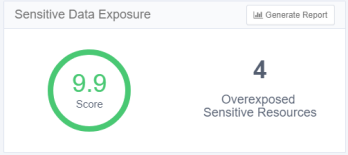 |
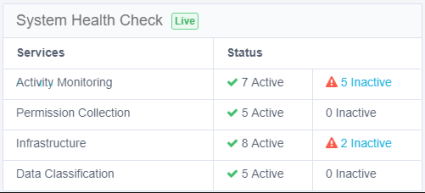
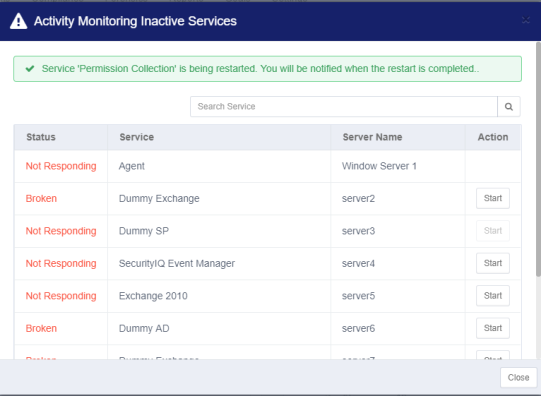
System Health Check
The System Health Check widget displays a list of active and inactive system services by service and status. Some services may be restarted from the widget.
Services are displayed by category, and the status indicates the total number of active and inactive services. The status of a service can be either active or inactive, where "inactive" indicates a potential problem.
Viewing Inactive Services
-
Select a blue Inactive link.
An Inactive Services screen displays a table with the following columns:Column Name Description Status Not Responding, Broken Service Service name Server Name The name of the server on which the service resides. Since the System Health Check screen shows the current active servers, this can be used to tell the user which server is active, in a configuration of Disaster Recovery / Production / high availability. Action Start [Enabled]
Start [Disabled]
empty - no screen action available -
Select Start in a row on the table to start the service in that row.
-
Select Close to close the Activity Monitoring Inactive Services screen.
Notes
- This widget does not have a report.
- Update frequency: Data is updated continuously.
Disaster Recovery Considerations
When you have a Disaster Recovery environment configured, all the services are duplicated - one set in Standby mode, one set in Active mode. The Activity Monitoring Inactive Services panel (see above) displays the active server name. The System Health Check widget shows only the active server services.
The System Health Check widget always shows the current active services, regardless of the physical environment being used, such as Disaster Recovery or Production.
Important
Services marked as Inactive are services that are on the active servers in terms of Disaster Recovery, but are inactive.
Activity Statistics
The Activity Statistics widget displays a trend graph of activities per application. The chart displays one application per tab, for a maximum of five tabs. You can select which applications to monitor by adding or removing tabs.
Timeline
Set the time in which to aggregate the data. This will affect the report output as well.
Valid values are:
-
Last 24 Hours
-
Last 72 Hours
-
Last 7 Days
-
Last 30 Days
Activity Statistics graph
Hover the mouse over any point on the graph to display the number of activities on a given date and time.
Select a point on the graph to drill down to the activity forensics screen with a list of activities per resource. In the web client, you can also reach this screen by navigating to Forensics > Activities.
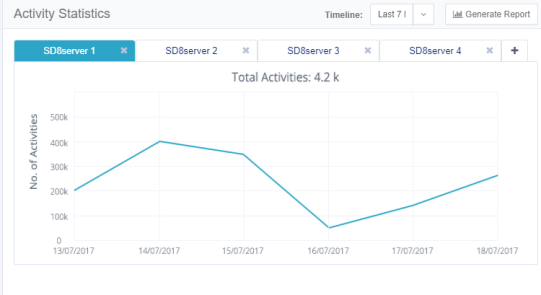
Activity Statistics Widget
To add a tab, select the + to the right of the tabs and enter an application name to add. This field offers autocomplete.
To remove a tab, select the X on the tab title.
For reporting, select Generate Report to create a detailed activities report according to the timeline and applications selected. When the report is generated it can be accessed in Reports > My Reports.
Update frequency - The data on this widget updates continuously.
Alerts in Last 7 Days
The Alerts in Last 7 Days widget displays the number of alerts created within the last seven days.
Alerts in Last 7 Days Graph
Hover the mouse over any portion of a bar graph to display a tool tip with information on the number of alerts of a specific type, the alert date, and the group for whom the alert was issued.

Report - Select Generate Report to create a detailed alerts report. When the report is generated it can be accessed in Reports > My Reports.
Update frequency - The data on this widget updates continuously.
Active Data Classification Policies
The Active Data Classification Policies widget displays the active data classification policies in a separate graph for each policy. Each graph displays the five applications with the most policy-classified resources.
The main portions of the Activities Statistics widget are:
-
Number of Policies
-
The number is in parentheses after the widget name.
-
Only one policy bar graph displays at a time.
-
Select the arrows to the right or left of the graph to display graphs for other policies.
-
-
Generate Report
-
Active Data Classification Policy graph
-
This graph shows the number of resources for each of the five top applications for a given policy.
-
Select a bar on the graph to display the list of classified resources in the selected application.
-
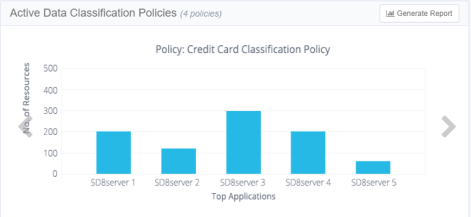
Update frequency - The Active Data Classification Policy graph is updated once a day, by default.
Active Campaigns
The Active Campaigns widget displays a graph showing the progress of active campaigns, with a separate screen for each campaign.
The main portions of the Active Campaigns widget are:
-
Number of Active/In Progress Campaigns
-
The number appears in parentheses after the widget name.
-
Only one campaign circle graph displays at a time.
-
Select the arrows to display the graphs of other campaigns. The arrow to the right displays the next graph and the arrow to the left displays the previous graph of the graph.
-
-
Generate Report
-
Active Campaign graph
-
This circle graph shows the percentage of records for each active campaign, as well as the campaign status. Approved is green, rejected is red, and pending is gray.
-
Select a segment in the graph to drill down to a screen that lists pending records per reviewer in a selected campaign. You can also display this screen by navigating to Compliance > Access Certification.
-
Update frequency - The Active Campaigns widget is updated once a day, by default.
Top Sensitive Resources by Activity
The Top Sensitive Resources widget displays a table of the sensitive resources with classified data and the most activities within a selected timeframe. The table includes columns for the number of categories and number of activities for each resource listed.
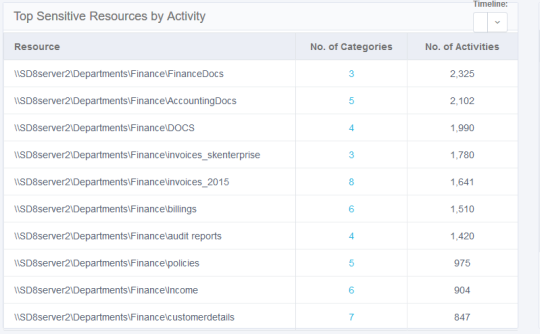
Select the No. of Categories value in a resource to display the names of the categories.
Update frequency - The Top Sensitive Resources widget updates continuously.
Top Users with Pending Tasks
The Top Users with Pending Tasks widget displays a table of users with the highest number of pending tasks. Examples of tasks are access certifications and access requests.
The table includes columns for the name of the user, the number of pending tasks, and a button for sending a reminder to the user.
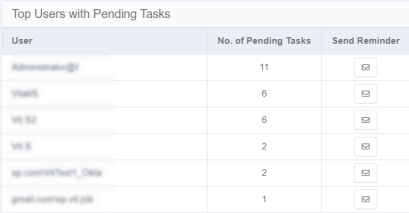
Select Send Reminder in the user's row to send them a reminder of their pending tasks.
The following alert displays: “Email reminder to [User FullName] is being sent. Notification will be provided upon completion.”
Update frequency - This widget is updated continuously by default.