Usage Dashboard
View your data on the Usage dashboard to determine if your organization has any unused licenses or compliance issues. The data within this dashboard can also help you make informed decisions on renewal and purchasing decisions.
Understanding your usage data
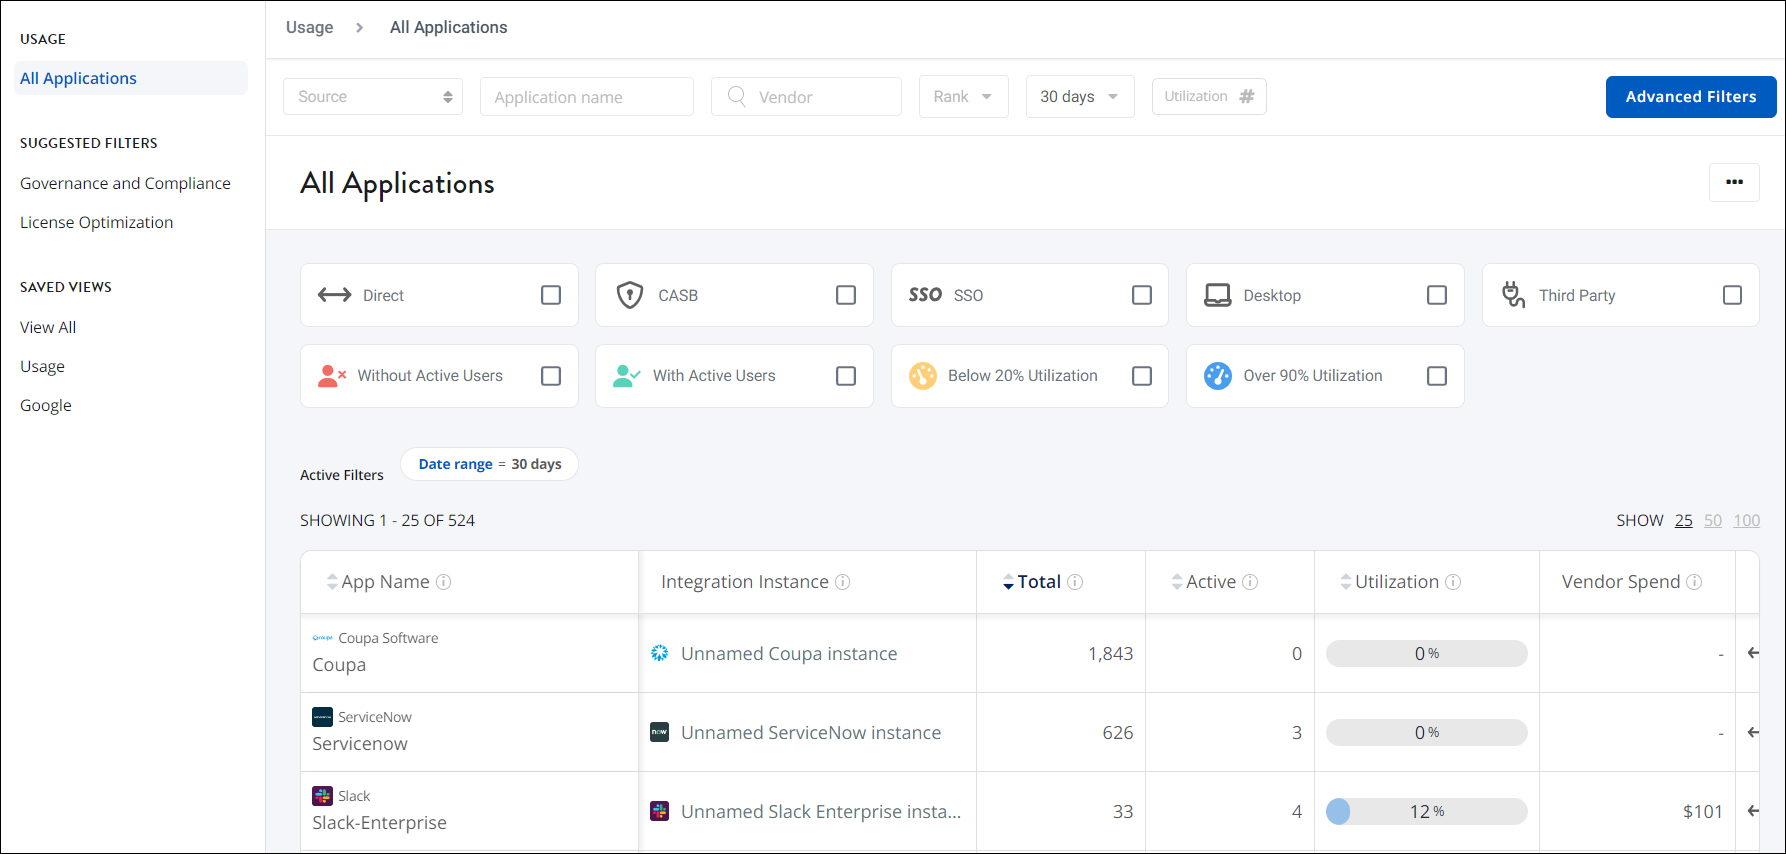
The Usage dashboard displays a list of your organization’s applications and their related usage data. To start reviewing your data, you can select a quick filter.
Quick filters
The Usage Dashboard offers many quick filters that allow you to quickly focus on specific applications to better review and analyze your utilization data. For example, selecting the Over 90% utilization filter displays applications that have high utilization and may require more licenses.
Select the checkbox for the filter you want to use. You can add multiple quick filters at a time.
The table below describes each quick filter on the Usage Dashboard.
| Filter | Description |
|---|---|
| Direct | View action-based-level data that is pulled directly from the application. This data is the most accurate since it’s pulled directly from the source. |
| CASB | View event-based data that is pulled from cloud access security broker (CASB) applications. |
| SSO | View event-based data that is pulled from your SSO. SSO integrations pull in data when you authenticate via the SSO with an application. |
| Desktop | View event-based data from your desktop service provider. This data is pulled into SaaS Management when a user uses an app on their desktop. |
| Third Party | View event-based data from third-party applications. This data is pulled when a user initially authenticates an integration with a third-party application. For example, SaaS Management pulls in data whenever a user initially authenticates their Google account to another SaaS provider. |
| Without Active Users | View instances that have no active users. Use to determine whether your organization should cancel licenses for these applications to reduce SaaS spend and prevent security risks. |
| With Active Users | View instances that have active users. Use to focus only on applications with active users. |
| Below 20% utilization | View instances that have 20% utilization or less. Focus on applications with low utilization to determine whether you should lower your license counts or consolidate your apps and instances. |
| Over 90% utilization | View instances that have 90% utilization or more. Focus on applications with high utilization to determine which may require more licenses. |
Applications and instances
The Usage Dashboard displays your organization’s applications and their instances in SaaS Management.
An application may appear multiple times on the dashboard in the following cases:
- The application was integrated with SaaS Management in multiple ways. For example, an application may have been integrated directly with SaaS Management as well as indirectly when the SSO that the application is behind was integrated.
-
The application has multiple instances. For example, your organization may have integrated both your staging and production environments of an application.
To help differentiate between instances, you can enter a descriptive name for your instance when you integrate an application with SaaS Management. To edit an instance name, update the instance and enter a new name in the Instance Name field.
Utilization
Use the Utilization column to inform your licensing decisions. Utilization is the percentage of the number of active users compared to the total number of users. If your organization has a high percentage of utilization for an application, you can review the data for this application to determine if your organization needs to purchase more licenses for users.
Application Users
Selecting a row on the Applications page displays a list of users and their activity data within the application. This data includes the following information:
- The number of days the user has been active within the application.
- The dates the user was first and last active in the application.
- The date their account was created within the application.
To view the utilization of the application over time, select the View Time button.
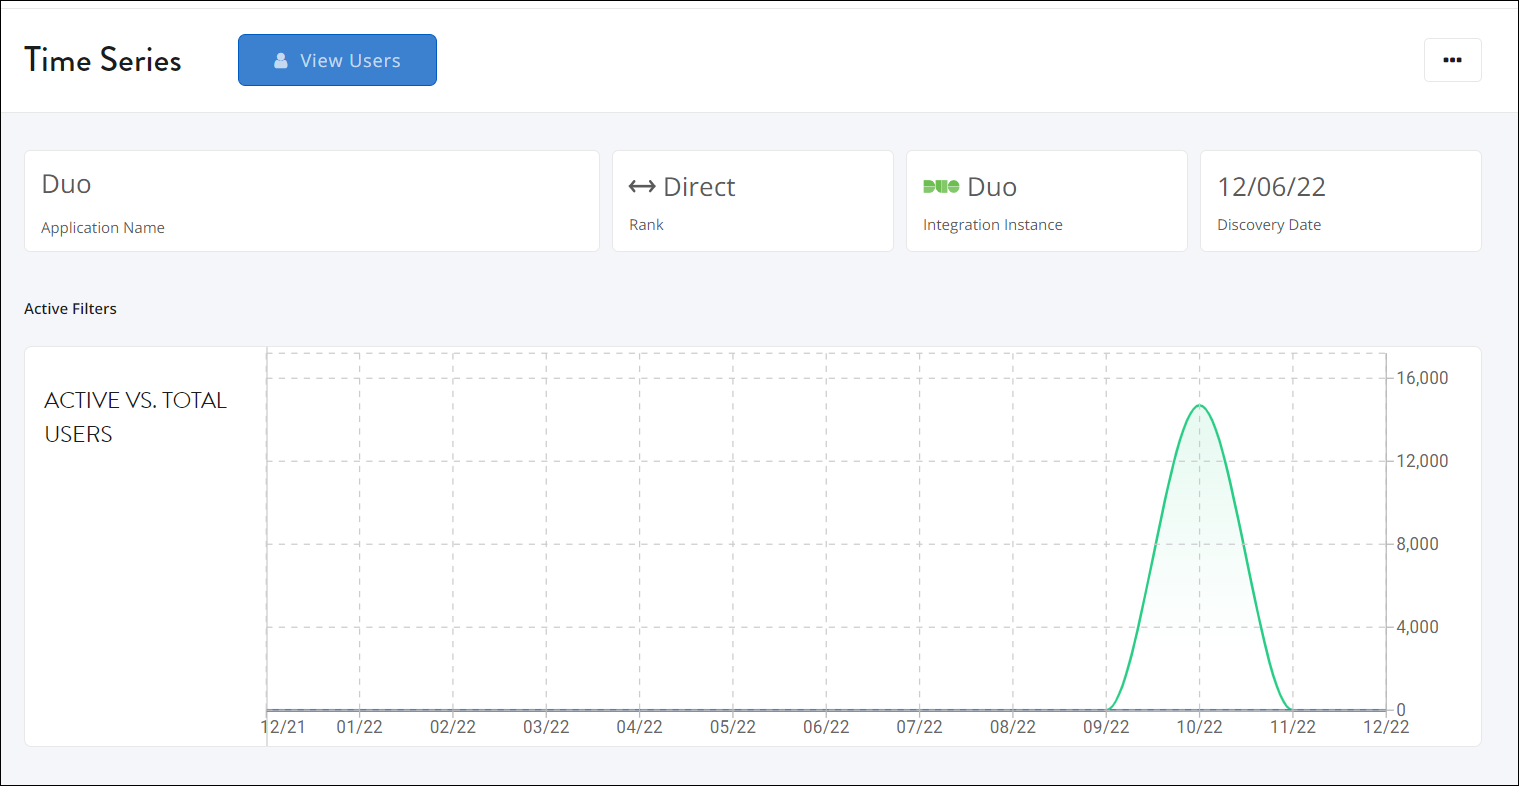
Select the View Users button to return to the list of users.
Documentation Feedback
Feedback is provided as an informational resource only and does not form part of SailPoint’s official product documentation. SailPoint does not warrant or make any guarantees about the feedback (including without limitation as to its accuracy, relevance, or reliability). All feedback is subject to the terms set forth at https://developer.sailpoint.com/discuss/tos.