Using the Administrator Console
Use the Administrator Console link, under the gear icon, to access the Administrator Console and view the Task, Provisioning, and Environment monitoring tables.
-
Manage Task Results
-
Manage Provisioning Transaction Results
-
Monitoring Your Environment
Access to the Administrator Console is controlled with IdentityIQ rights.
Manage Task Results
Use the Tasks table to view host affinity check run time data. From this page you can also postpone a scheduled task, terminate a running task, or dump a stack trace of a running task. The stack trace is typically used when a task is running long and diagnostics are needed.
Use the tabs at the top of the table to limit your view by task status: Active Tab, Scheduled Tab, or Completed Tab. Use the Filter options or search field to further limit the tasks displayed.
Postponing Tasks
Tasks which are scheduled to run in the future can be postponed for a selected amount of time.
-
Click the Scheduled tab to see future scheduled tasks.
-
Click the calendar button (Postpone Task) in the Actions column.
-
Choose the date and time when the task should run again and click Submit.
The system will automatically prevent any instances of that task from running until the designated time.
After the designated time has passed, the task will resume on its normal schedule. It will not be run immediately at the time specified in the postponement.
Terminating a Task
Tasks which are currently executing can usually be terminated from the IdentityIQ UI.
-
Click the Active tab on the Administrator Console Tasks page to see currently running tasks.
-
If a task is running longer than expected or otherwise needs to be immediately terminated, click the X button in the Actions column to send a terminate request to the task.
All of SailPoint's out-of-the-box tasks have logic in them that will respond to a terminate request and shut down gracefully at the next logical breakpoint. Custom tasks should also be written to handle a terminate request.
This terminate action can also be done from the Task Results page in Setup > Tasks > Task Results by right-clicking the task and clicking Terminate. However, permissions which grant access to the Administrator Console are different than the permissions required for the Setup > Tasks page, so some users may only have access to this feature from the Administrator Console. See the Task Results Page for more information.
Requesting a Stack Trace
When troubleshooting abnormal task behavior (most notably, long-running tasks), it may be helpful to get a stack trace of the task's current execution.
-
Click the Active tab of the Administrator Console Tasks page to see currently running tasks.
-
Click the </> button in the Actions column on any running task row to generate a stack trace for that task. A dialog box appears, to confirm that the stack trace has been requested and will be available soon.
-
The stack trace will be generated and the </> button will be colored green when it is available.
-
Click the green </> button to view the stack trace in a dialog box. You can generate another stack trace for the same task, if it is still executing, with the Request New Stack Trace button in that dialog box.
Note that workflows also generate task result objects which, are included on this page. Since the Stack Trace option does not apply to a workflow, this option is not enabled for those entries in the list.
Active Tab
This tab displays all of the tasks that are currently running.
Use the Actions column to terminate a running task or request a stack trace, if a task is running long and you would like to see diagnostics.
Name - Name of the task
Type - Task type
Start Date - Name of the task
Owner - The task owner, not necessarily the identity who requested the task be run
Host - Host on which the task is currently running
Current Runtime - How long the task has been actively running
Average Runtime - The time that this task has historically taken to complete
Scheduled Tab
This tab displays all of the tasks that are scheduled to run in the future, including those that are scheduled to run periodically, for example Perform Maintenance.
Use the Actions column to postpone a scheduled task or delete a schedule. No instance of a postponed task will be performed until after the selected date.
Name - Name of the task
Type - Task type
Task - Name of the task
Host - Host on which the task is scheduled to run
Next Execution - The next time this task is scheduled to run
Last Execution - The last time this task was executed
Last Result - The result of the last run, for example Success or Failed
Owner - The task owner, not necessarily the identity who requested the task be run
Completed Tab
This tab displays all of the tasks that have completed, regardless of the result.
Name - Name of the task
Type - Task type
Result - The result of the last test run
Start Date - The date and time at which this task began
Date Complete - The date and time at which this task stop running
Owner - The task owner, not necessarily the identity who requested the task be run
Host - Host on which the task was run
Average Runtime - The time that this task has historically taken to complete
Runtime - The actual runtime
Diff from Average - The difference between the actual and average runtimes
Manage Provisioning Transaction Results
Note
This feature can be disabled and might not appear in your instance of IdentityIQ. Contact your system administrator for details.
Use the Provisioning Transactions table to view the status of all provisioning transactions in your implementation of IdentityIQ: connectors, manual work items, and IdentityIQ operations.
To access the Provisioning Transaction table, click the gear icon > Administrator Console > Provisioning.
Four pages of data are available for review: All, Failure, Success, and Pending. The first page (All), which is displayed by default, shows all logged provisioning transactions. The other three pages display transactions which ended in failure, success, and pending statuses (retry) respectively, depending on the logging configuration, which is described in the section below.
Managing the Contents of the Provisioning Transaction Table
By default, the Provisioning Transaction table only displays transactions that have resulted in a failure condition, but it can be configured to display all provisioning transactions which are processed through IdentityIQ.
To change this default, change the logging level for Provisioning Transactions:
-
Click the gear icon > Global Settings > IdentityIQ Configuration > Miscellaneous.
-
In the Provisioning Transaction Log Settings section, change Maximum Log Level to Retry or Success.
-
Retry means the system will log provisioning transactions that return a Failure result or a Retry result (an error message indicating a temporary condition that means a later retry of the provisioning operation will likely succeed and should therefore be auto-retried after a delay interval).
-
Success means the system will log all provisioning transactions, regardless of their provisioning result status values.
-
Days before provisioning transaction event deletionNote.
-
-
Optionally, set a Days before provisioning transaction event deletion value. If you set the Maximum Log Level to Success, the provisioning transaction log will record high volumes of records.Therefore, it is particularly important in that case to also set the Days before provisioning transaction event deletion value to the number of days you want to retain these records so they will be automatically purged after that time. Leaving this value as the default "0" means these records will never be deleted, which can fill your database quickly. Even when using a Retry or Failure maximum log level, this value should be set to purge records you no longer need.
-
To turn off provisioning transaction logging entirely, clear the Enable Provisioning Transaction Log box.
-
Save your changes.
Use the tabs at the top of the table to limit your view by transaction status: All, Failure, Success, or Pending. Use the Filter options or search field to further limit the transactions displayed.
Reporting on Provisioning Transactions
Use the report/download button to launch a Provisioning Transaction Object report in the background. From the Report Launched window, you can click Get Email Notification to receive an email when the report is complete, or View Report to display the Report Results page.
The information on this page is also available in two reports available from the Intelligence > Reports menu: the Provisioning Transaction Object Report and the Detailed Provisioning Object Report. See Provisioning Transaction Object Report and Detailed Provisioning Transaction Object Report for more information.
Click the information icon for any transaction to view detailed information. The Transaction Details window displays all available details about the selected provisioning transaction, including attribute-level information about the request and any applicable error messages.
The Transaction Details window provides very detailed information, including the reasons for a Failed or Pending status. After viewing, you can take the appropriate actions to correct the reasons for the failure or delay.
Forcing Retries for Retryable Errors
Retryable errors are recorded as Pending transactions in the Provisioning Transactions table. Though these transactions will automatically retry after a configured interval, an administrator can override the retry interval and force a transaction to retry immediately. For example, suppose a network error causes a retryable error. Ten minutes later, the problem is fixed but the wait period on the retry is set for the transaction to retry after two hours. The administrator can speed up the process by forcing the retry to occur immediately after the network issue is resolved.
For any Pending transaction, a Retry button is shown in the Actions column. These retryable transactions appear on both the All page and the Pending page, and can be forced to retry from either page.
To force an immediate retry of a pending transaction, click its Retry button. The Retry Launched pop-up window appears, confirming that the retry has begun.
Failed transactions cannot be retried; you must use the override option to create a new work item for those transactions.
Overriding Failed Transactions with Manual Work Items
Transactions which appear as Failures are considered permanent failures and will never be retried automatically by the system. Likewise, they cannot be forcibly retried from the Provisioning Transactions table user interface. However, they can be reprocessed manually by creating a manual work item assigned to a person to complete the request outside of IdentityIQ's automated operations. In short, the transaction reprocessing is done just as if it were a provisioning request for a disconnected system (an application with no automated provisioning channel from IdentityIQ).
The administrator can view failed transactions on the All and Failure pages. To reprocess a failed transaction through a manual work item, click Override in the Actions column.
Next, choose the user to whom the manual work item should be assigned, and enter comments to communicate with that person; the comments are included in the manual work item. The choices for assignee are the Application Owner for the target application, yourself, or Other (another user). If you choose Assign to Other, you will be prompted to select the target user from a list.
Finally, click Override on this pop-up window to complete the failure override process and generate the manual work item. An Override Success message appears , confirming that the override has been completed and the manual work item has been generated.
The original transaction remains in the Provisioning Transactions table with a Failure status, for historical information purposes, though it no longer offers the Override option because the override has already been done. A new Provisioning Transactions table entry gets created for the override manual work item. Both the new manual record and the failed auto record reflect the umber, so they can be connected through that information as needed.
Note
Just like with manual work items for provisioning to disconnected systems (systems with no automated provisioning channel from IdentityIQ), override work items are treated as successfully completed in the Provisioning Transactions table when the manual work item generated. Consequently, the Success override transaction appears in the Provisioning Transactions table immediately.
Monitoring Your Environment
The Environment Monitoring console in the Administrator console provides insight into each defined application's health and the status of your modules and extensions via a single dashboard. This helps administrators of both on-premises and cloud-based installations get insights into a number of environment statistics for both hosts and applications, and diagnose connectivity issues within the environment.
Access the Environment Monitoring console by following these steps:
-
Select the gear icon.
-
Select Administrator Console.
-
From the left-hand menu, select Environment.
Use the gear icon on the right side of the title bar to define global settings for all hosts in IdentityIQ. These settings are used for all hosts that have not explicitly overridden the defaults.
The Environment console has tabs for Hosts, Applications, and SailPoint Modules and Extensions.
On each tab, select the Columns button at the upper right side of the page to choose and arrange the information displayed on the pages. When you select the Add Column button, any other available columns appear as dropdown options. Use the search field to locate specific servers.
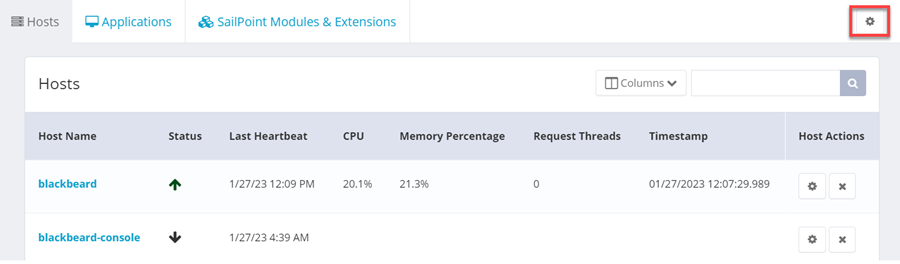
Hosts
The Hosts tab in the Environment console displays all of the hosts associated with an IdentityIQ instance, along with statistics about the state of each host in the selected column.
A search box in the upper right lets you search for servers. This is a "starts with" search rather than a full-text search, and it is not case-sensitive.
You can add, remove, or reorder the columns on this tab. Columns may include:
-
Host Name – name of the machine hosting the IdentityIQ instance.
-
Status – a color-coded arrow icon indicating whether the host is up or down.
-
Last Heartbeat – the last time the host verified its functionality. Each host periodically sets a date in the server object to verify it is still running. If the verification date does not advance for a specified period of time, the other servers detect and mark the server as having crashed.
-
CPU – a percentage representation of the workload sustained by the host machine CPU.
-
Memory Percentage – the percentage of the maximum allowed memory which is actively in use by the application server's Java virtual machine.
-
Request Threads – the number of request processor threads running on this host.
-
Timestamp – the last time the monitoring service ran.
-
Database Response Time – the number of milliseconds it last took to connect to the database and query from it.
-
Task Threads – the number of background tasks running on this host.
-
Memory – the amount of memory (in bytes) actively in use by the application server's Java virtual machine.
-
Host Actions – action buttons to configure or delete hosts.
Note
For hosts running on Unix operating systems, there is an option, Open Files—Unix Only, that displays the number of open files to avoid running out of file handles. This count is on the operating system, not the application server. This column can only be enabled manually from the UI Configuration object on the debug pages.
Global Host Configuration
You can set global Environment Monitoring options for all your hosts by selecting the gear in the title bar. Settings you choose here are used for all hosts, but you can also set specific options for individual hosts (described below) to override many of these global settings on a per-host basis.
These are the options you can configure globally for your hosts:
-
Polling Interval – the number of seconds between monitoring cycles.
-
Statistics Retention – the number of days monitoring statistics will be retained. Enter a zero here to retain statistics indefinitely.
-
CPU – a percentage representation of the workload sustained by the host machine CPU.
-
Task Threads – the number of background tasks running on this host.
-
Request Threads – the number of request processor threads running on this host.
-
Database Response Time – the number of milliseconds it last took to connect to the database and query from it.
-
Memory – the amount of memory (in bytes) actively in use by the application server's Java virtual machine.
-
Memory Percentage – the percentage of the maximum allowed memory which is actively in use by the application server's Java virtual machine.
Host-Specific Configuration and Monitoring
Each host can be configured by clicking the gear in the Host Actions column for that host.
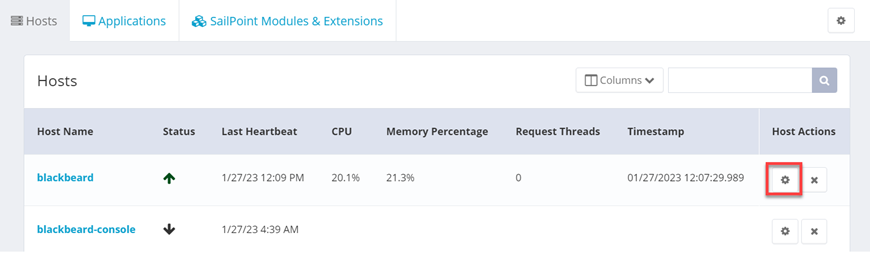
When you select the gear icon, the Host Setting dialog appears with two tabs, Services and Configuration, enabling you to specify the services running on each host and configure host monitoring.
Services
The Services tab lets you toggle to enable or disable the services running on a specific host. Many of these services can be managed through the UI. The one exception is the Request service, which cannot be fully shut down.
When a service is shut down, the host still processes requests that have been specifically targeted to that host, but does not pick up generic, or untargeted, requests.
Monitoring Service
The Monitoring service captures and saves the latest statistics, promotes any statistics-related extended attributes to the Server object, and prunes any statistics that have outlived the configured retention period. The Monitoring service populates the task threads, request threads, and cpu usage statistics as well as statistics for memory usage, memory usage percentage, and database response time.
Reanimator Service
The Reanimator service helps manage "hung" tasks. A task can sometimes fail without properly updating the state of the TaskResult.This can leave the task in a hung state. The most common causes for this kind of issue are a temporary loss of connection to the database or a brief database server failure. Regardless of the underlying reason, the Reanimator service performs the task of resetting requests or tasks so they can resume.
The service can also help with terminating a task or request that is not configured to resume upon being orphaned or failing. If the task or request is not configured to resume, then when the service detects a task in a hung state, it automatically marks it as terminated.
Note
If you are using Email Task Alerts in any of your task definitions, be aware that when a task hangs and is restarted by the reanimator service, email task alert notifications may not be sent.
The Reanimator service runs by default on all hosts. Although it is unlikely that you would need to switch it off, it is possible to do so. For example, if you have a dedicated UI host, you might not need this service running there.
To disable the Reanimator service on a specific host:
-
On the Hosts tab, select the gear icon beside the specific host on which you want to disable the service.
-
On the Services tab of the Host Configuration dialog, use the slider to switch off the Reanimator service.
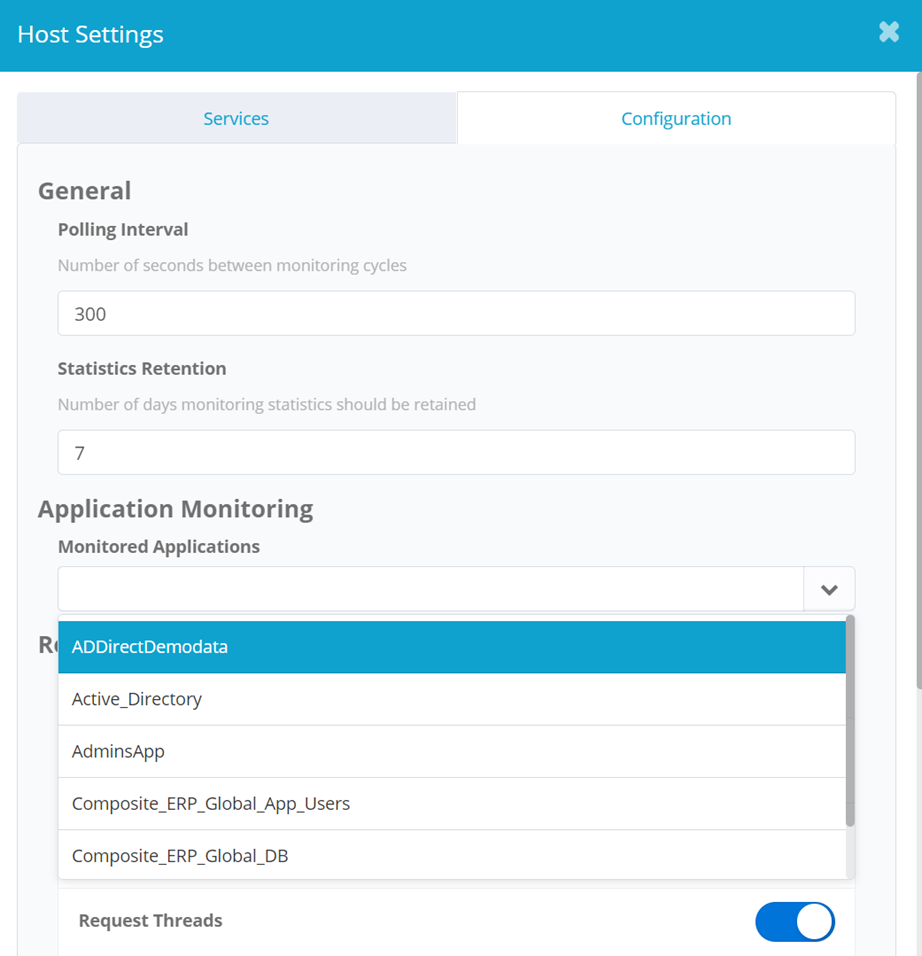
Configuration
The Configuration tab lets you set up host-specific monitoring configuration. What you set here overrides the global defaults for Polling Interval, Statistics Retention, and to enable and disable given retained statistics, such as CPU or task threads.
The Configuration tab also lets you select applications to monitor. Any applications you select for monitoring are contacted each time the monitoring service runs and a health check status is recorded.
The Use Default Settings button at the bottom of the Configuration tab clears your Monitoring Configuration for this host and reverts this host to the global defaults. See Monitoring Applications.
Note
When you restore default settings, any applications you have selected for Application Monitoring are retained; restoring default settings does not remove any applications you have selected for monitoring.
Note
Administrators can assign a given host to handle specific types of requests. See Specifying Hosts to Handle Requests.
Viewing Host Statistics
Select a name in the Host Name column to show all server statistics captured for that host, grouped in time-based Statistic Snapshots. A host's snapshots can be cycled using the previous and next arrows to the left and right of the header or individually selected using the dropdown list.
Choosing Which Host Statistics to Display
You can choose which statistics to show on the Hosts tab and in which order they appear.
-
To edit what is shown on the Hosts tab, select the Column button.
-
To add columns, select Add Column and choose the new column(s) to include.
-
To change the order of the statistics, use the arrow buttons on each column tile, or drag the tiles into the order you prefer.
-
To remove a column from the Hosts tab, select Remove on the column tile.
-
Save your changes before exiting.
Deleting Hosts
Use the X button in the Host Actions column to delete hosts. Deleting a host removes the associated Server object and any related configuration or statistics for the given host.
The host no longer appears in the list of hosts after deletion. However, if the underlying server is still running, the host will reappear the next time its heartbeat service runs. All configuration settings for a regenerated host use the defaults for its list of services and for the monitoring service configuration.
Specifying Hosts to Handle Requests
In a multi-host environment, you can specify which hosts can process specific types of requests, by including a single host or list of hosts in a RequestDefinition object. This can help with performance, allowing you to dedicate specific machines and threads for processing request types that are, for example, operating at a high volume or require more resources.
-
When logged in as an administrator, select the wrench icon dropdown at the top of the screen, then select Object.
-
In the Debug pages, choose RequestDefinition in the Select an Object field of the Object Browser.
-
From the list of RequestDefinition objects, select the object that you want to modify in order to specify a host or list of hosts.
-
Add host entry to the RequestDefinition attribute map. The value can be set to a single host, or multiple hosts separated by commas. For example:
-
Select Save to save the updated RequestDefinition object or Close to cancel changes.
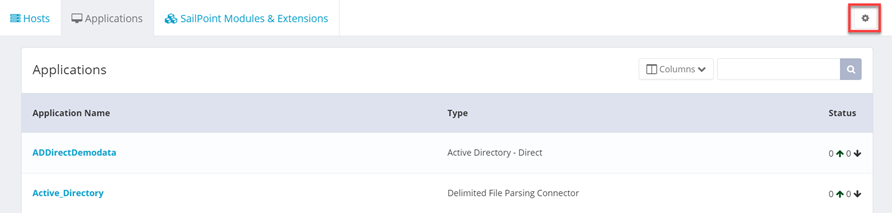
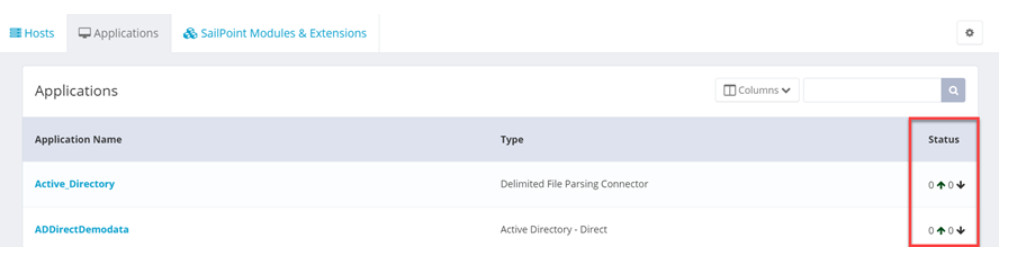
Applications
The Application tab in the Environment console provides a view from an application-up perspective. Application monitoring is configured per host, giving each a list of applications you want that specific host to monitor. Each application is listed, along with its type and a summary of all statuses reported by all configured hosts. Monitoring can be run from any number of servers on any subset of applications.
Select an application name to display a panel containing detailed information about the application's statuses. The panel shows each host that has reported a status for the application, as well as the status – up or down – and time of the most recent ping.
If you have full access rights, select the refresh icon to schedule a request for the host to perform a health check for an application. The refresh icon is then disabled until the request is fulfilled.
Note
An application must be monitored by at least one host before it can report statistics.
Global Application Configuration
You can set global monitoring options for all your hosts and applications by selecting the gear in the title bar. Settings you choose here are used for all hosts and associated applications in the same way.
These are the options you can configure globally:
-
Polling Interval – the number of seconds between monitoring cycles.
-
Statistics Retention – the number of days monitoring statistics will be retained. Enter a zero here to retain statistics indefinitely.
-
CPU – a percentage representation of the workload sustained by the host machine CPU.
-
Task Threads – the number of background tasks running on this host.
-
Request Threads – the number of request processor threads running on this host.
-
Database Response Time – the number of milliseconds it last took to connect to the database and query from it.
-
Memory – the amount of memory (in bytes) actively in use by the application server's Java virtual machine.
-
Memory Percentage – the percentage of the maximum allowed memory which is actively in use by the application server's Java virtual machine.
Note
For hosts running on Unix operating systems, there is an option, Open Files – Unix Only, that displays the number of open files to avoid running out of file handles. This count is on the operating system, not the application server. This column can only be enabled manually from the UI Configuration object on the debug pages.
Setting Up Application Monitoring
To set up an application to be monitored, navigate to the Hosts tab, then complete the following:

-
On the Hosts page, select the gear icon in the Host Actions column for the host that you want set up to monitor applications.
-
Select the Configure tab for that host.
-
In the Application Monitoring section, choose the applications to monitor; you can type in application names, or use the dropdown listing browse for applications. You can choose as many hosts as you like.
-
Select Save.
Monitoring Applications
-
Select the gear menu > Administrator Console > Environment.
-
Select the Applications tab.
-
All your applications are listed. The applications that are being monitored have numbers in the status column, indicating the number of hosts showing the application as being responsive (up arrow) and the number of hosts showing the application as down (down arrow). To search for specific applications, use the Search box.
-
Select an application name to see details:
-
Status – an arrow indicates whether the application is up (running) or down.
-
Last ping – a timestamp of the most recent ping to the application.
-
-
To re-ping the application and refresh the status, select the Refresh icon.
Environment Monitoring Objects
The IdentityIQ object model includes some objects related to Environment Monitoring.
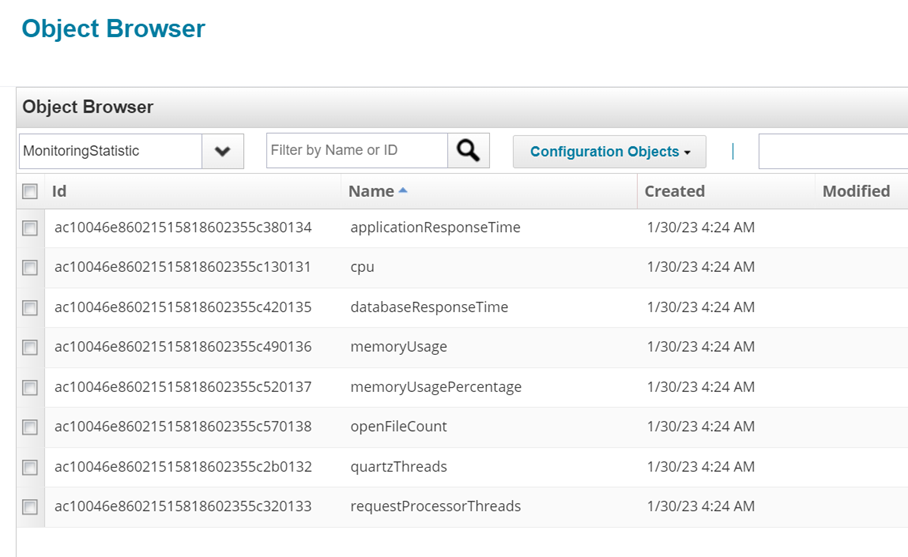
Monitoring Statistic Object
An object type, MonitoringStatistic, defines what you can monitor on all your hosts. The objects of this type do not hold any of the monitoring data; they simply define which statistics can be monitored. You can customize the Environment Monitoring UI via changes to this object, that is, by adding or removing individual MonitoringStatistic objects.
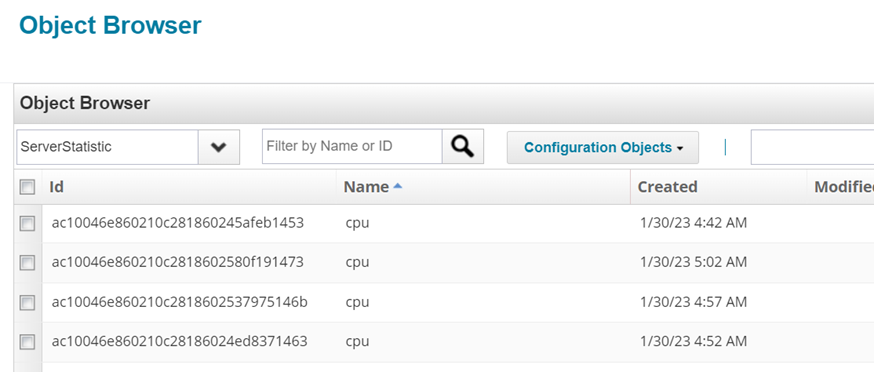
Server Statistic Object
Objects of type ServerStatistic contain the statistics for monitored hosts. The number of ServerStatistic objects you can see in the Debug pages varies depending on how long you have configured Environment Monitoring to retain statistics and how frequently the monitoring service runs.
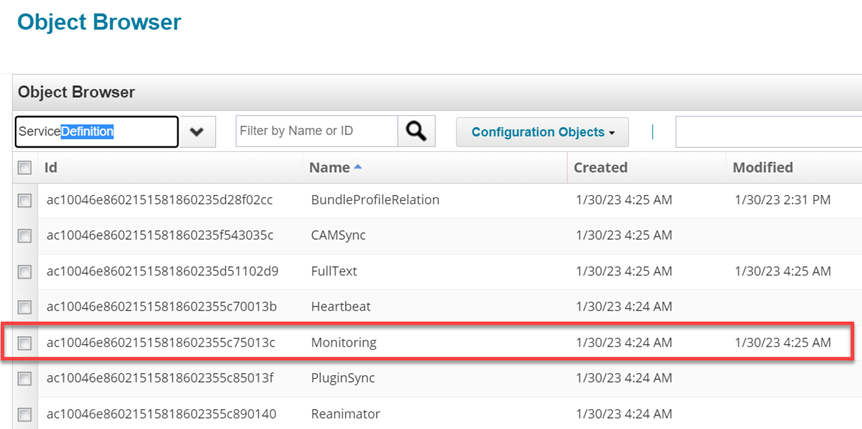
Global ServiceDefinition for Monitoring
The ServiceDefinition object contains the default monitoring configuration for all servers; you can override the configuration settings defined here on a server-by-server basis by settings in the monitoringConfig entry in the Server object, as described in the section below.
Server-Specific Monitoring Settings in the Server Object
Each server can define its own specific monitoring configuration. If a monitoring configuration is defined in the Server object, it will override the global default configuration for this host. The Server object can include an entry named monitoringConfig in its attribute Map.
<entry key="monitoringConfig">
        <value>
        <Map>
            <entry key="retentionPeriodDays">
            <value>
                <Integer>30</Integer>
            </value>
            </entry>
            <entry key='monitoringStatistics'>
            <value>
                <List>
                <String>cpu</String>
                </List>
            </value>
            </entry>
        </Map>
        </value>
    </entry>
Application Monitoring in Server Objects
Information about applications that are being monitored is stored in the Server object for each host, in the monitoredApplications entry key that is part of the monitoringConfig:
<entry key="monitoringConfig">
        <value>
        <Map>
            <entry key="monitoredApplications">
            <value>
                <List>
                <String>ADDirectDemodata</String>
                <String>Composite_ERP_Global_App_Users</String>
                <String>Active_Directory</String>
                <String>Composite_ERP_Global_DB</String>
                </List>
            </value>
            </entry>
        </Map>
        </value>
    </entry>
SailPoint Modules and Extensions
The SailPoint Modules and Extensions tab provides a list of all installed modules and extensions, a brief description, and a summary of all statuses reported.
Select a module or extension name to see a list of reported statuses and the corresponding Last Ping timestamp. When the Problem Detected icon is present, select it for more information about the nature of the problem.