Viewing Request Progress
Members of an access profile used for a request can view the request in the EAM Dashboard. As Requests move through each stage, the appropriate users on the profile are notified by email and can view the changes in the EAM Dashboard.
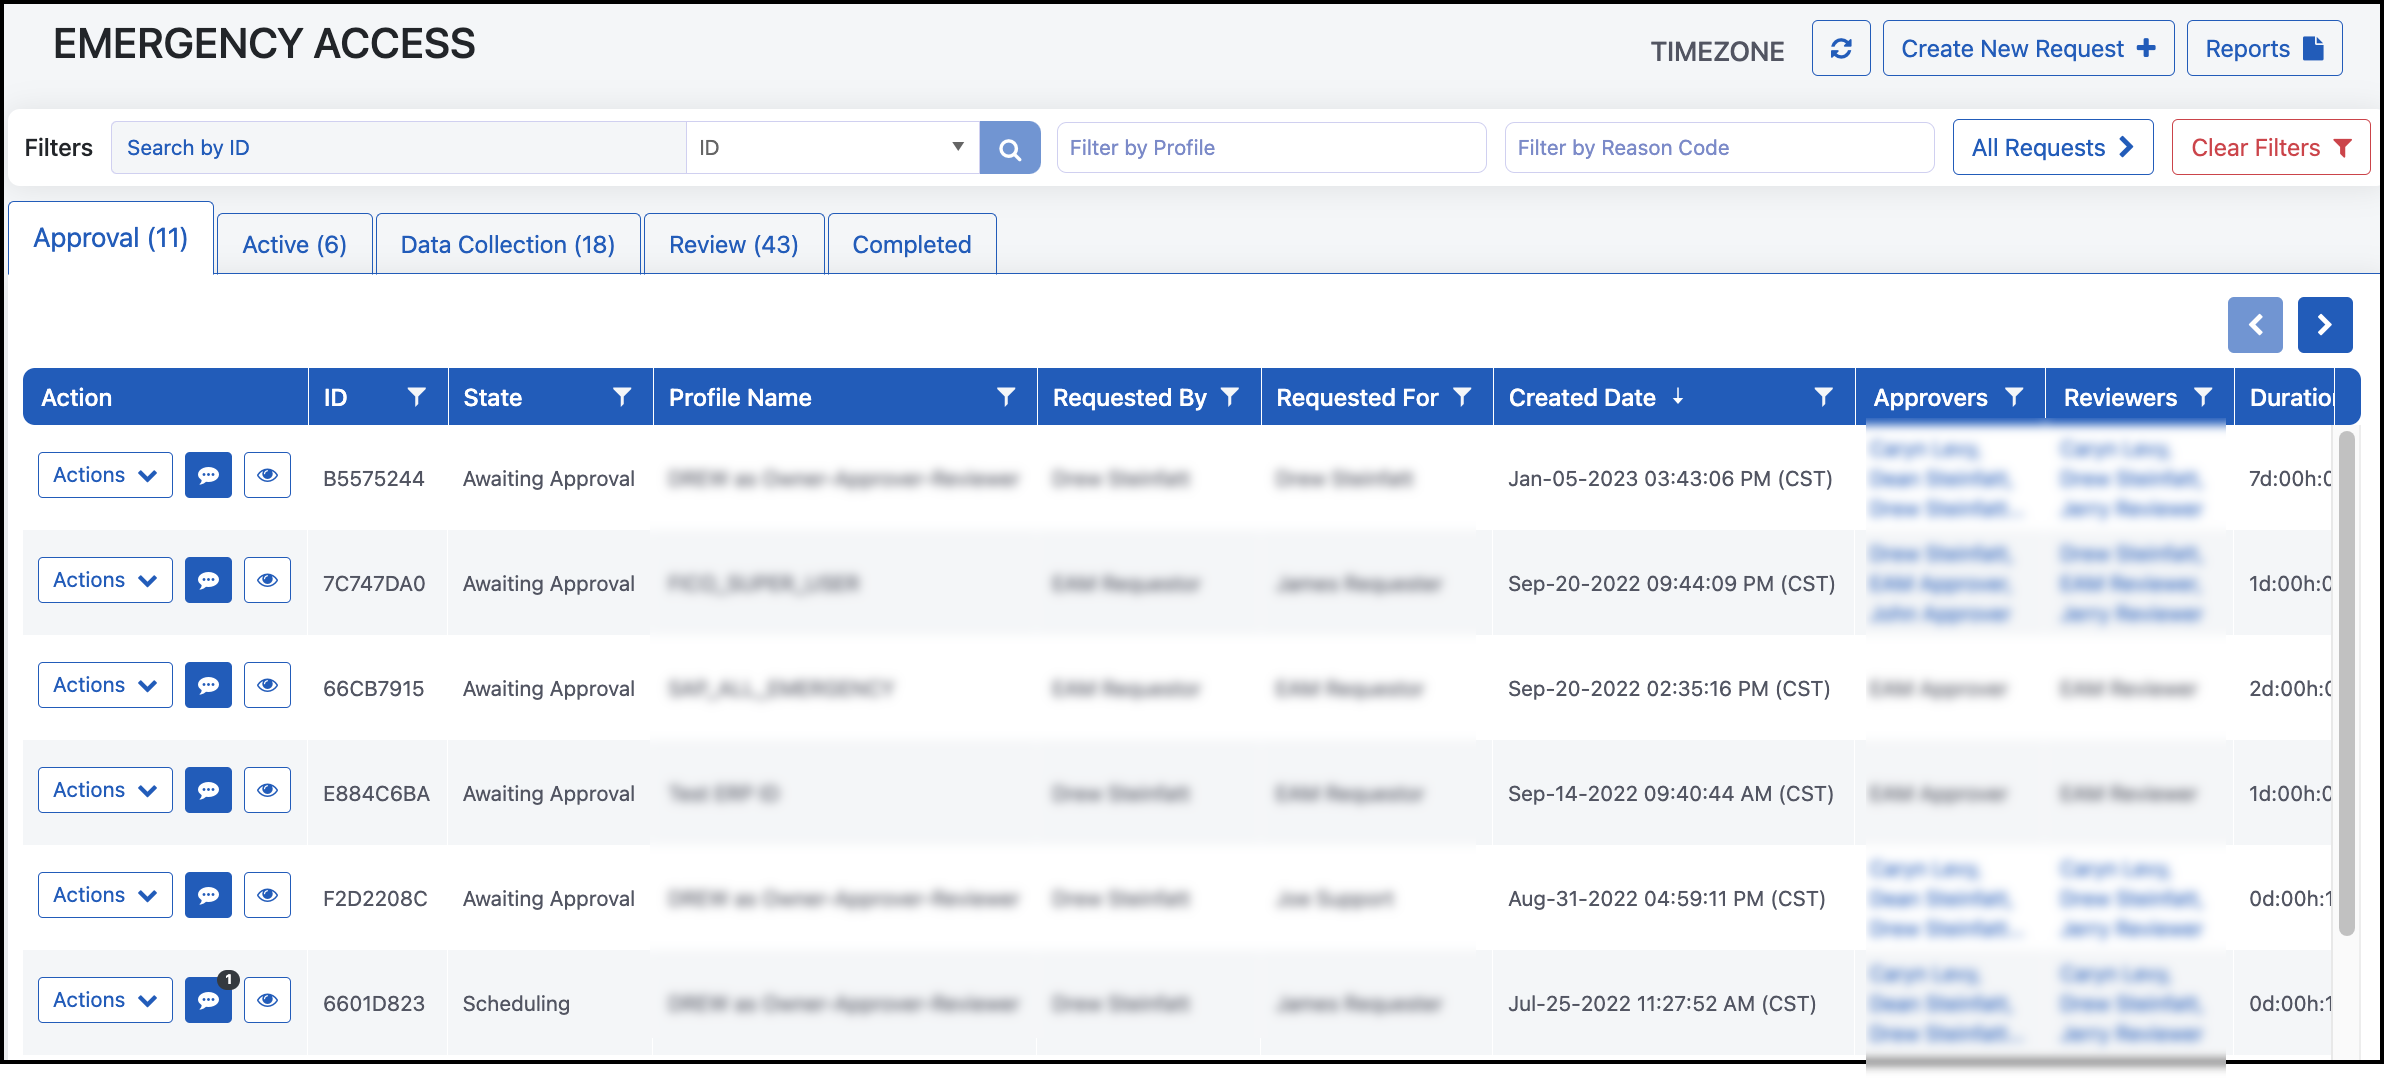
Each tab displays a core phase of the request process:
-
Approval - Requests that are waiting for approval
-
Active - Approved requests that are scheduled to be provisioned, or are actively being provisioned or deprovisioned
-
Data Collection - Requests that have been deprovisioned and are waiting to extract data of how the Requestor used the entitlements
-
Review - Requests under review to determine if the permissions were used appropriately
-
Completed - Requests that have been rejected, retracted, or reviewed
The number of requests in each stage is displayed in the parentheses in the tab headers. These numbers will change if you filter requests.
Note
You may need to select the Refresh icon ![]() to display changes to emergency requests.
to display changes to emergency requests.
Generating Reports
You can generate and download a set of reports for a single or multiple requests to provide to auditors or enforce compliance. Refer to Generating EAM Reports for more information.
Customizing Your Dashboard
Request information is by default displayed in the time zone configured in the user's browser. Users can change the time zone displayed on their personal EAM Dashboard by selecting Timezone and choosing a different time zone.
You can reorder and resize columns by clicking and dragging the column headers. Column customizations are reset when the EAM Dashboard is refreshed.
Filtering Requests
The EAM Dashboard features multiple filters to help find requests and identify errors.
Filtering within columns
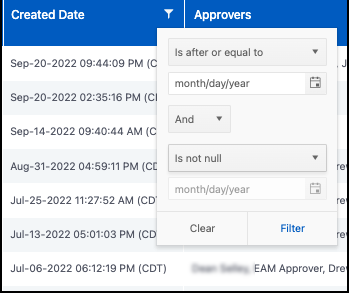
To filter requests within a column, select the Filter icon ![]() in an available column header and enter your parameters. Select Filter to set the filter, or Clear to remove filters in the column.
in an available column header and enter your parameters. Select Filter to set the filter, or Clear to remove filters in the column.
Filtering by metadata
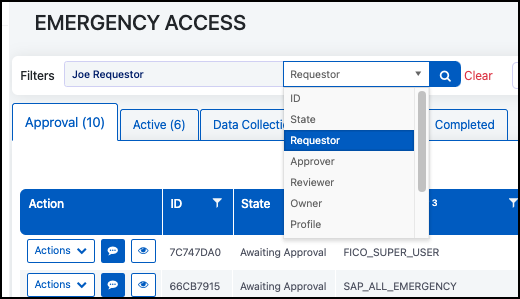
You can select the metadata to filter requests by using the bar above the table.
Enter your search term, select the data type from the dropdown list, and select the Search icon ![]() . Requests can be filtered by:
. Requests can be filtered by:
| ID | Requestor | Reviewer | Reason | Entitlement |
| State | Approver | Owner | Profile | Comment |
Filtering by Profile and Reason Code
You can also filter by Profiles and Reason Codes by selecting the fields and choosing the profiles or codes. To remove all filters, select Clear Filters.
Filtering by Errors
Select the button in the top right to toggle between displaying all requests, requests with errors, and requests without errors. This makes it easier to identify if a provisioning, deprovisioning, or data collection job needs to be restarted or attested. The text on the button indicates what is displayed in the table below.
Documentation Feedback
Feedback is provided as an informational resource only and does not form part of SailPoint’s official product documentation. SailPoint does not warrant or make any guarantees about the feedback (including without limitation as to its accuracy, relevance, or reliability). All feedback is subject to the terms set forth at https://developer.sailpoint.com/discuss/tos.


