User Risks History
The User Risks History graph shows the historical trends of the organization's risks over time to indicate if something has changed in your environment. If your additional controls are effective, the line will stay flat. If something has changed in your security that is causing risk, the line will rise.
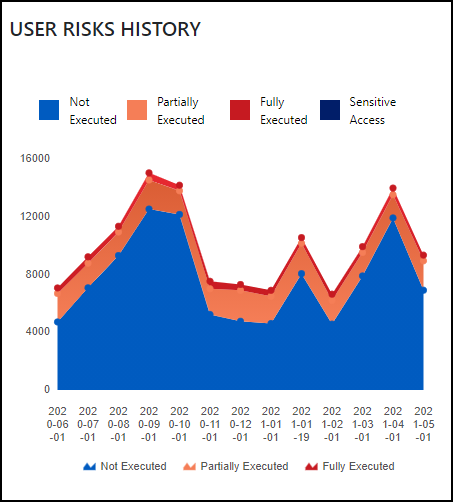
Use Case
The graph is also frequently used to report risks over a period. This can be helpful in determining when to review your risks again. If there is fluctuation in the risk history, you may want to reevaluate your controls using the other available dashboard reports.
Documentation Feedback
Feedback is provided as an informational resource only and does not form part of SailPoint’s official product documentation. SailPoint does not warrant or make any guarantees about the feedback (including without limitation as to its accuracy, relevance, or reliability). All feedback is subject to the terms set forth at https://developer.sailpoint.com/discuss/tos.