Viewing Online Reports - New
Note
This page contains information for the latest Online Reports functionality. The former Online Reports functionality is also still supported. Refer to Viewing Online Reports.
Access Risk Management generates many online reports for user activity, role usage and risks, executions, and properties. These reports can help you determine where risk lies within your organization so you can take remediation or mitigating actions.
Report types include:
Navigating the Report UI
View online reports by selecting Online Reports from the left navigation. Select the tabs at the top of the page to go to different report pages.
The crosshatch arrows icon ![]() at the top of the screen moves you to full-screen mode, showing only the reporting data. Select ESC to exit full-screen mode.
at the top of the screen moves you to full-screen mode, showing only the reporting data. Select ESC to exit full-screen mode.
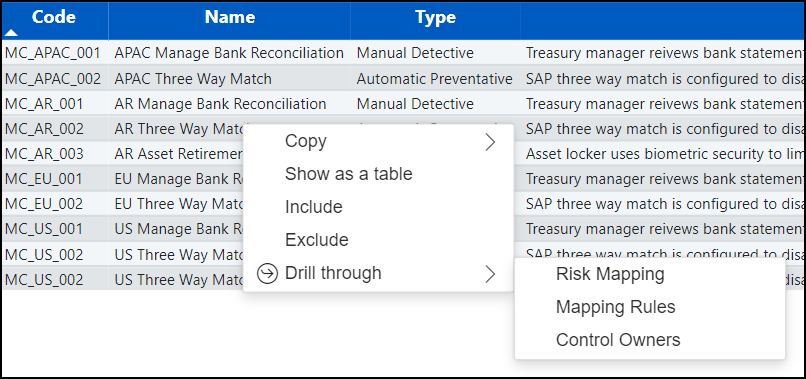
For any item in the data tables and report visuals, you can hover over or right click, select Drill Through, and choose an option to trace additional data specific to that item.

Hovering over data tables or visuals brings up a set of icons at the upper right. They are:
- Filters
 – List every filter that is currently applied in your view.
 - Personalize this Visual
 (available for visuals only) – Personalize the appearance of a dashboard widget, including visualization type, y-axis, x-axis, legend, etc.
 - Focus Mode
 – Remove the tabs and filtering options above the table to view only the report data.
 - More Options
 – Select an option, such as Export Data, Show as a table, Spotlight, Get insights, and sorting options. Export Data lets you export your filtered report data, with or without formatting.
Note
While data is loading, a spinning disk icon appears in the top left corner of each dashboard widget.
Filtering Your View
Use filters to include only the data you’re interested in. The most common reporting filters are found at the top of each page. Select the dropdown arrow in a field to view and select options. Press and hold Ctrl to select multiple dropdown options. Adjust date ranges by entering dates, using the sliders under the date fields, or selecting the calendar icons.
Note
Filter options differ depending on which report is selected. Your view may include different options than are shown in the screenshot below.

Advanced filters are on the right side of the page. Use the small double arrows at the top to show or hide the Filters panel.

Once you’ve applied a filter, its filter card is highlighted to let you know that it has been applied. You can select the eraser icon at the right side of the card to remove that filter from your report.
Filter cards include basic filtering, and some offer advanced filtering as well. Advanced logic includes options such as contains, does not contain, starts with, is, is not, etc.
Note
There may be an Analysis ID error in the advanced filtering window; it does not impact your reporting.
In the data table’s column headers, a small arrow indicates the column(s) being used to sort. The direction of the arrow indicates whether it’s sorting in ascending or descending order, and you can select it to change directions. Select multiple sorting columns by holding down Shift while selecting column headers.
To cross-filter the visuals, hold Ctrl while you select the visuals and/or filters that you want to include.
Use the clear all filters icon ![]() to remove all filters currently applied.
to remove all filters currently applied.
Note
The Analysis Selector button does not impact the data used in online EAM or Mitigations metadata reporting. It is used for reports that rely on a specific SoD Risk Analysis.
Documentation Feedback
Feedback is provided as an informational resource only and does not form part of SailPoint’s official product documentation. SailPoint does not warrant or make any guarantees about the feedback (including without limitation as to its accuracy, relevance, or reliability). All feedback is subject to the terms set forth at https://developer.sailpoint.com/discuss/tos.