Viewing Activity History
Some actions, like scheduling an analysis or approving a provisioning request, generate job entries in the Activity History Dashboard. Use the Activity History dashboard to track analyses, change logs, data exports, data imports, reports, security extracts, utilization extracts, provisioning, and validators.
You can view or download entries, restart failed jobs, and view additional granular information about the outcome of these actions using the dashboard.
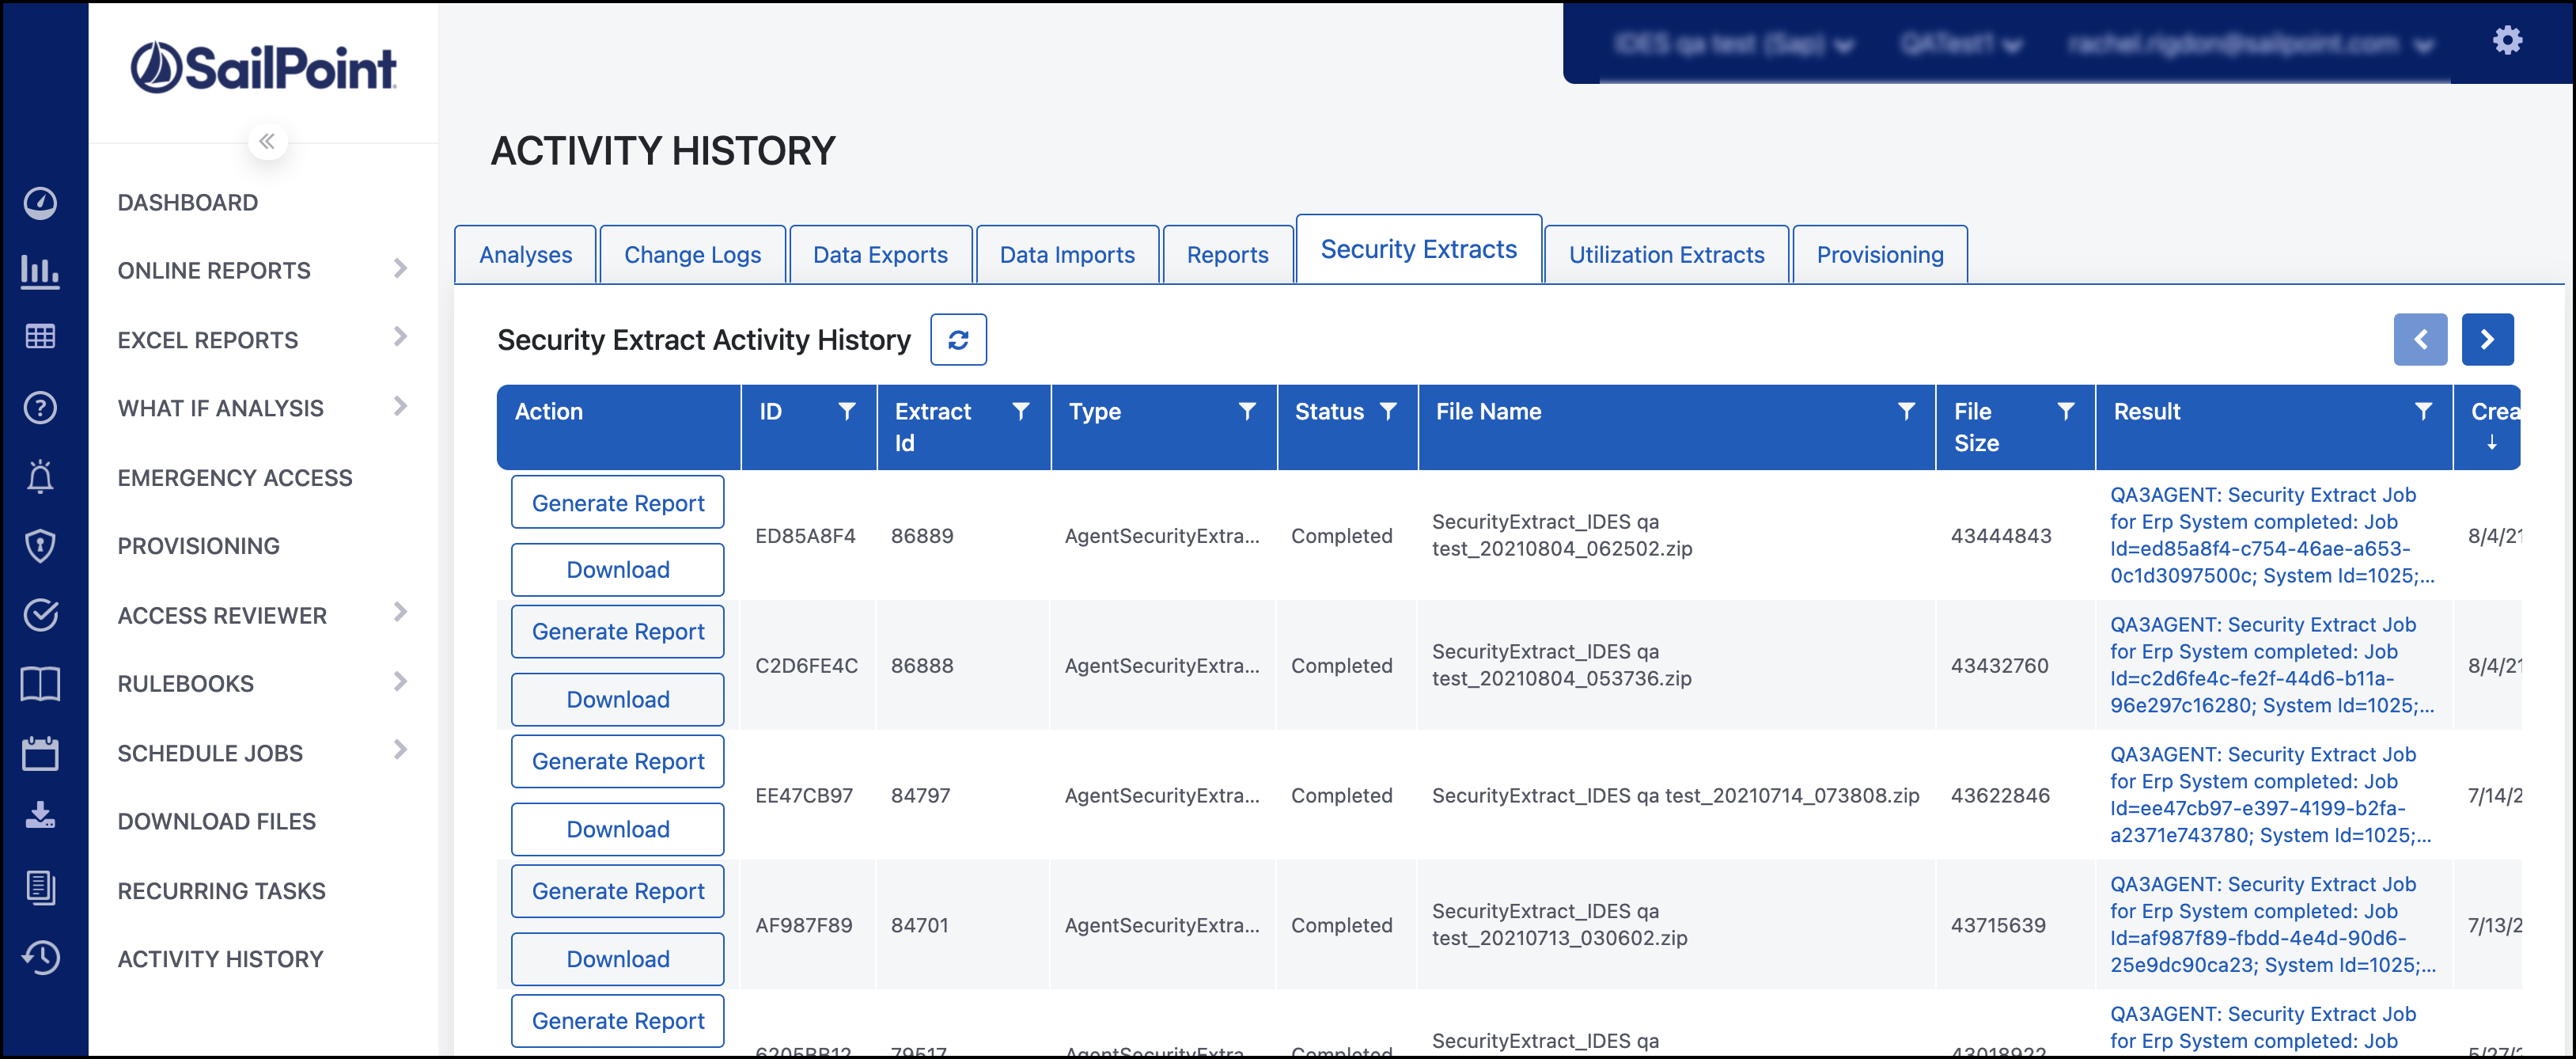
On the Activity History page, use the tabs to quickly view job details for each activity category. The columns provide specific details about the selected job activity so that you can find and understand the outcomes of your job requests.
Select the Refresh icon ![]() to update the table. Use the Filter icon
to update the table. Use the Filter icon ![]() to create a query for that column.
to create a query for that column.
For Security Extracts, the Results column includes the data validation outcome. When there are errors, you can select View Result in the Action column to view the data issues that caused the failure.
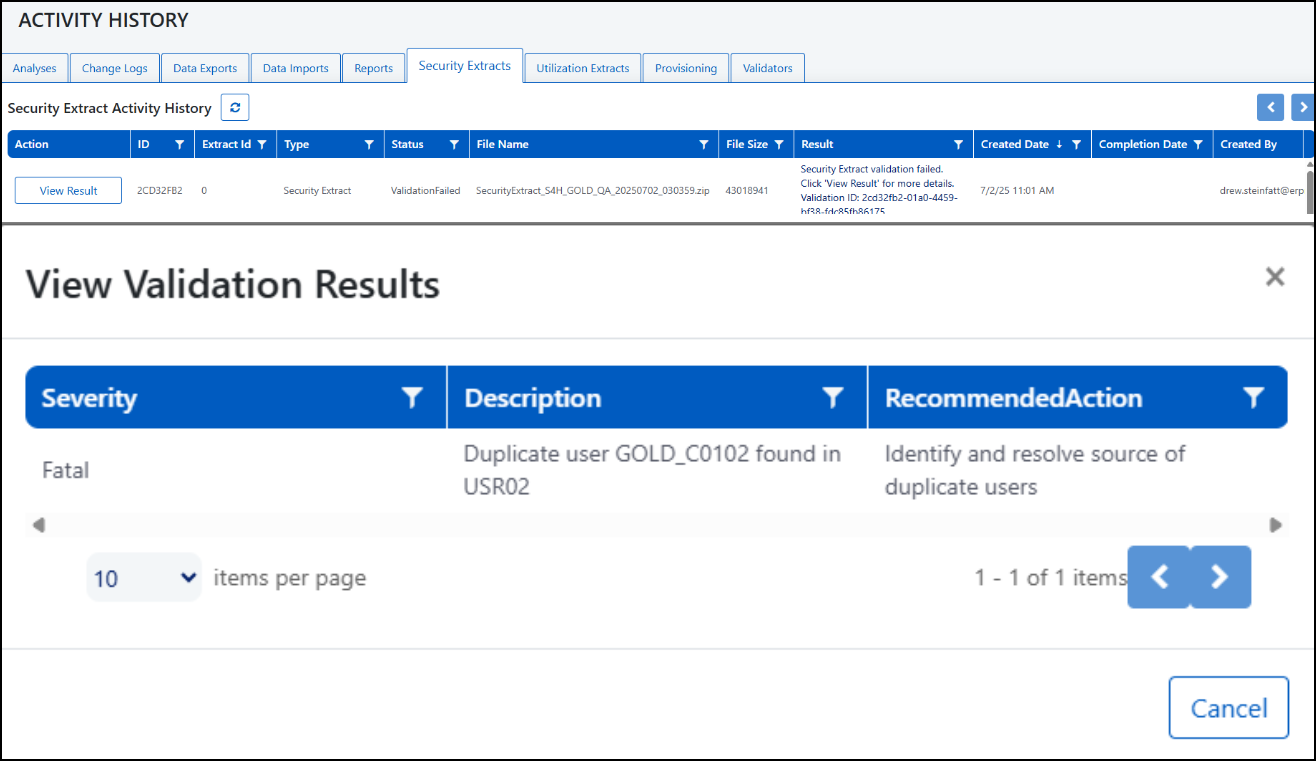
Note
Messages that exceed four lines of text, such as detailed error messages in the Result column, will show links that, when selected, show the full text that you can copy to your clipboard.
Viewing Utilization Extracts
To track newly-created utilization extract jobs or to download completed extracts, go to Activity History > Utilization Extracts.
The Utilization Extract Activity History table includes the following information for each extract:
- Action - When extracts successfully complete, the Download button is available to download and review the extracted data for validation.
- ID - Unique identifier of the utilization extract.
- Type - Type of extract.
- Status - Completed jobs show a status of Completed or, if the job failed, LoadFailure.
- Name - Name of the utilization extract. Legacy extracts are named STAD and SM20 extracts are named Security Audit Log.
- Description - Description of the extract. Includes the period covered by the extract in the format MMMM DD YYYY to MMMM DD YYYY.
- File Size - Size of the extract file expressed in bytes.
- Result - The results of the Utilization Extract action, including a reference ID that SailPoint customer support can use to quickly identify all logs associated with the job for efficient troubleshooting.
- Created Date - Date the extract was created.
- Completion Date - Date the extract was completed.
- Created By - For extracts that run from a scheduled recurrence, this field will say System. For one-time or ad hoc extracts, the username of the person who ran the report.
Viewing Security Analyses
To validate that online reports are based on the latest security analysis, go to Activity History and select the Analyses tab. Both ad hoc and scheduled analyses are listed on this page.
Locate the most recent successful Security Analysis. You can review details in the Description and Result columns. A timestamp in the Completion Date column indicates the date and time that the Security Analysis was completed.
Documentation Feedback
Feedback is provided as an informational resource only and does not form part of SailPoint’s official product documentation. SailPoint does not warrant or make any guarantees about the feedback (including without limitation as to its accuracy, relevance, or reliability). All feedback is subject to the terms set forth at https://developer.sailpoint.com/discuss/tos.