Viewing the Dashboard
The Risk Snapshot Dashboard shows a summary view of the risk in your environment. To populate and update the dashboard, select Schedule Jobs and choose Risk Snapshot.
The dashboard information is broken down by Risk Rating, Business Process, Users, and Roles.
Editing the Dashboard
Select Edit Dashboard at the upper right to arrange your view. Choose which widgets to include by selecting the checkbox next to each one listed in the Edit Dashboard pane. Select the arrows at the right of the widget’s name and drag up or down reorder them. When you are finished editing, select Cancel or Save.
Using Dashboard Filters
Select Filters to filter your dashboard content. In the Filters panel, select the checkboxes for the information you want to include, such as risk level, mitigation status, and types of TCode executions. Select Cancel or Apply when you are finished.
Viewing Your Current Risk Status
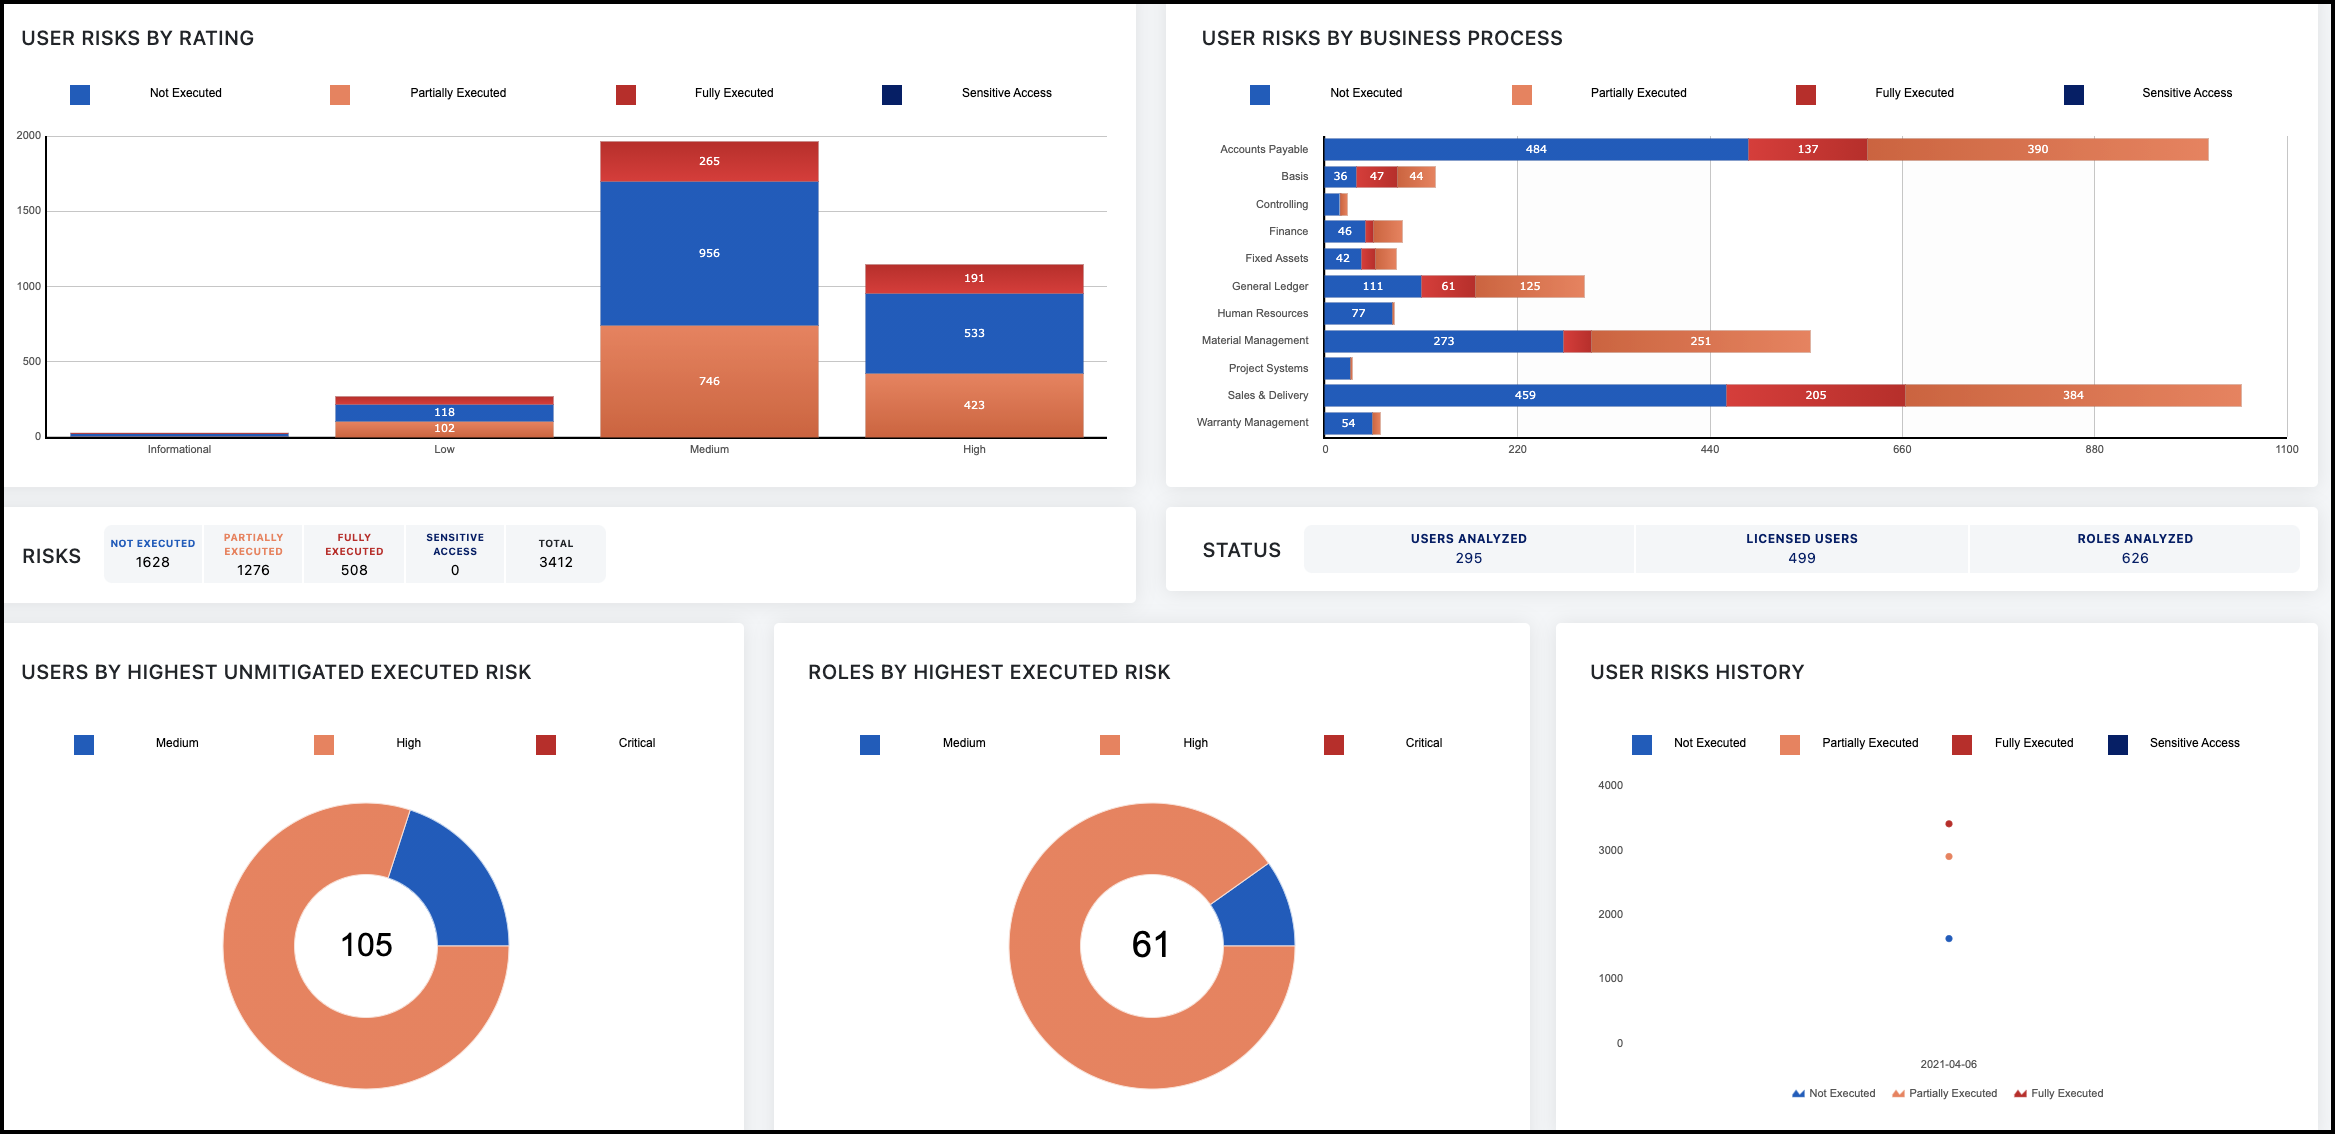
The dashboard provides insight into the overall risks in your environment. You can view the risk graphs for a high-level view or select areas within the graphs to see more granular reports - giving you the information you need to assess and remedy risks.
Information includes:
- User Risks by Rating
- User Risks by Business Process
- Users by Highest Unmitigated Risk
- Roles by Highest Executed Risk
- User Risks History
Access Risk Management risk ratings map to numeric ordering:
- 0 - Informational
- 1 - Low
- 2 - Medium
- 3 - High
- 4 - Critical
Risk ratings are also visible in some reports. For an example, refer to User Risk Summary by Rating.
User Risks by Rating
The User Risks by Rating report shows all the risks in the environment broken down by the risk rating defined in the rulebook. These are separated by the utilization of the users with access to those risks.

The graph shows four types of utilization and their associated risk levels:
-
Not Executed - A risk where the user has access to all business functions defined for that risk (one for a sensitive access risk and two or more for an SoD risk) but has not executed transactions from any of those functions.
-
Partially Executed - A risk where the user has access to all business functions associated with an SoD risk and has executed transaction codes associated with some, but not all, of the business functions.
-
Fully Executed - A risk where the user has access to all business functions associated with an SoD risk and has executed transaction codes from all of the business functions.
-
Sensitive Access - A sensitive access risk that requires access to only one function and the user has executed transaction codes associated with that function.
To see more details, you can select a section of the graph and navigate to the User Risk Level Details screen with the appropriate filters applied to match the selection.
Use Case
This summary-level report is often used by business owners or managers to see users who pose the most risk to the business. You can view and filter by the different levels of risk and see which users have that access. This can help determine if the users have access to the expected risks and if remediation is needed. If the reported users are not ones expected to have the risk, further remediation should occur. If remediation is not possible, mitigating controls can be assigned.
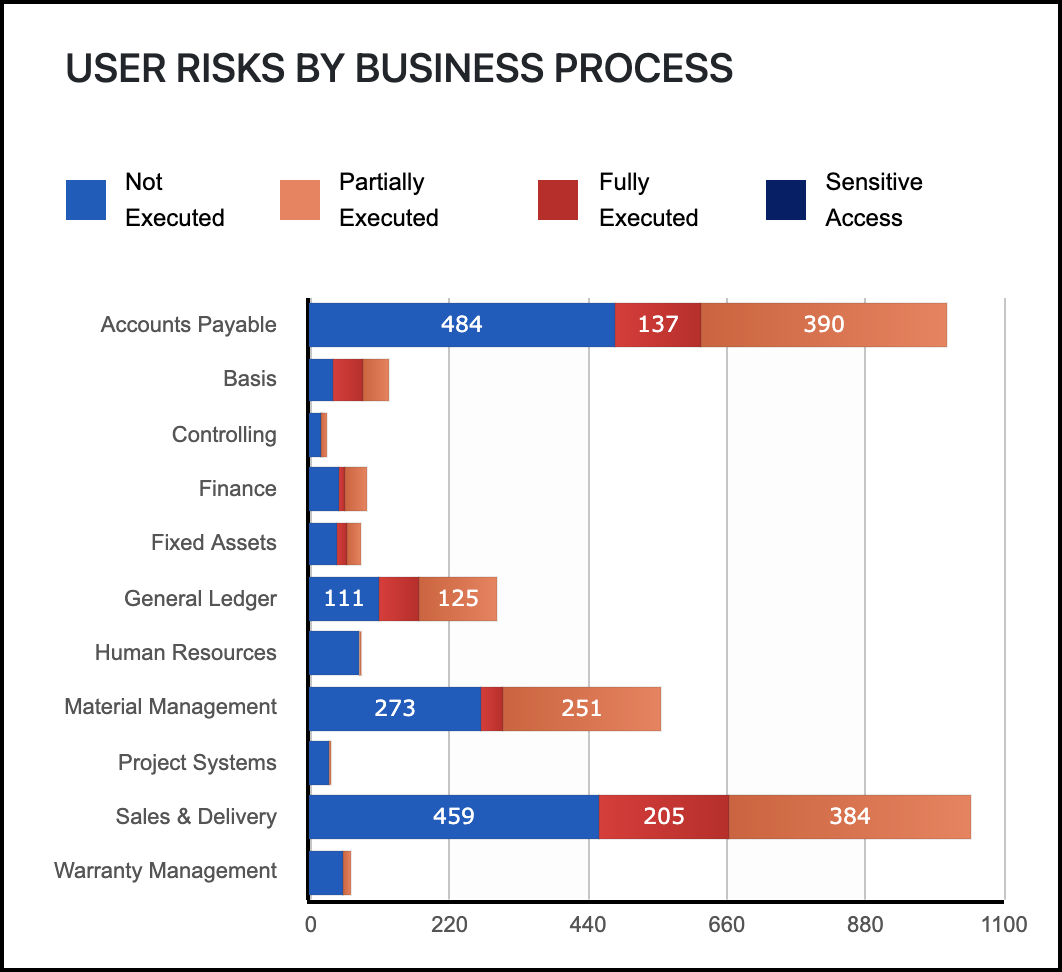
User Risks by Business Process
The User Risks by Business Process report contains similar information to the User Risks by Rating report, with the added dimension of the Process Area defined in the rulebook. The breakdown of risk and drill-down reporting acts the same as the User Risks by Rating and the total risk numbers will be the same.
Use Case
This summary-level report is often used by business process owners or owners of specific functional areas to review users who pose the most risk within their respective area. You can view and filter by the different business process areas and see which users have that access. This can identify if the expected users have access to the risks that might be expected of them so you can use that information to determine if risk remediation or mitigating controls are needed.
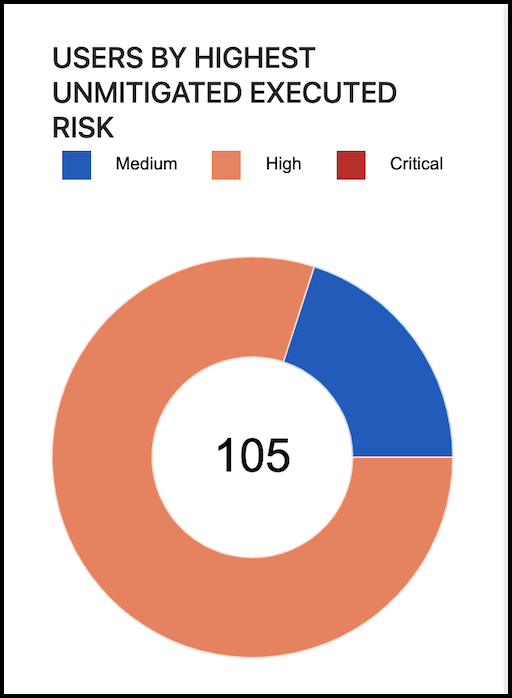
Users by Highest Unmitigated Risk
The User by Highest Unmitigated Risk report identifies how many unique users have executed both sides of an SoD or Sensitive Access Risk without having any mitigating controls assigned. Since a user can execute multiple risks, the report will display them based on the highest level of risk they have executed. Selecting a section of the graph will show the User Summary report with the correct filter applied on the Highest Level of Fully Executed Unmitigated Risk column.
Use Case
This report can help identify users who are the cause of the most issues. Most remediation projects will start with remediating roles to ensure that they are free of inherent risk and then analyze the users after. From there, you can determine if you should remediate by modifying business processes or job responsibilities or if you should apply a mitigating or manual control for that user / risk that can't be remediated otherwise.
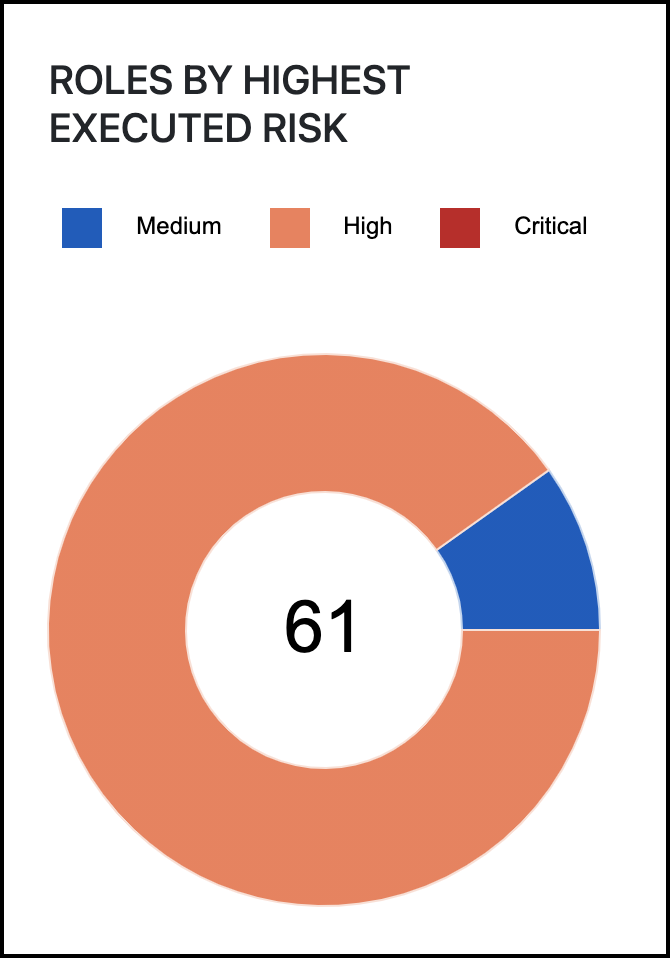
Roles by Highest Executed Risk
The Roles by Highest Executed Risk report identifies how many unique roles have an inherent SoD or sensitive access risk built in and indicates if that risk has been fully executed by the assigned users. Selecting this report will navigate to the Role Summary report and apply filters based on the Highest Level of Fully Executed Risk column.
Use Case
This report is often used to identify those roles that cause the most risk in your environment, which might be a place to focus initial remediation efforts. It can show roles that have execution on both sides.
Since it can be different users executing both sides, the role can be split, resulting in two roles that are inherently free of SoDs. For more information, refer to the Role Conflicts Matrix report.
User Risks History
The User Risks History graph shows the historical trends of the organization's risks over time to indicate if something has changed in your environment. If your additional controls are effective, the line will stay flat. If something has changed in your security that is causing risk, the line will rise.
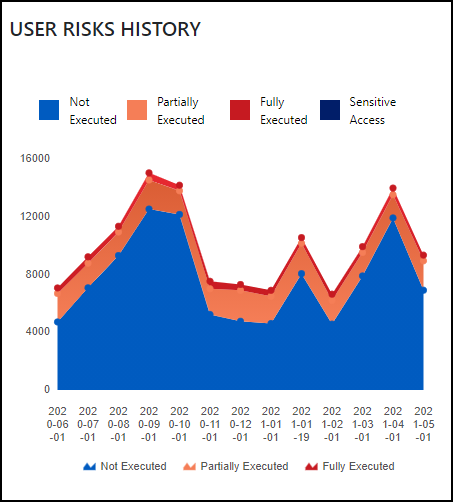
Use Case
The graph is also frequently used to report risks over a period. This can be helpful in determining when to review your risks again. If there is fluctuation in the risk history, you may want to reevaluate your controls using the other available dashboard reports.
Documentation Feedback
Feedback is provided as an informational resource only and does not form part of SailPoint’s official product documentation. SailPoint does not warrant or make any guarantees about the feedback (including without limitation as to its accuracy, relevance, or reliability). All feedback is subject to the terms set forth at https://developer.sailpoint.com/discuss/tos.