Viewing Online Reports
Access Risk Management generates online reports for analysis of separation of duties (SOD) and sensitive access risks at the authorization level for user conflicts as well as inherent role conflicts. Reports are also available for action execution summaries for risk remediation and long-term risk tracking across all governed systems. These reports can help you determine where risk lies within your organization so you can stay in compliance and remediate or mitigate risks as needed.
Available reports include:
- Analysis Properties - Enables auditing the inputs into a Risk Analysis including Rulebook details, User metadata, Role metadata, and User Role assignments.
- Role Risk Details - Comprehensive diagnostic view of role-based inherent SOD risks, offering full visibility into authorization-level granularity, user impacts, utilization, and corresponding mitigation coverage.
- User Risk Details - Comprehensive diagnostic view of user-based separation of duties risks due to combined role assignments, offering full visibility into authorization-level granularity, utilization, and corresponding mitigation coverage.
- User-Risk History - Global view of every user-risk instance across all of your governed SAP systems over time, including when the risk was first identified, and whether it has been mitigated or remediated.
- Execution Summary - Analyze all action executions at the User or Role level to understand utilization of the available actions, including those that are defined in the rulebook and carry some risk, and those that are not in the rulebook and involve no risk, such as display actions.
- Block List Exclusions - Unified overview at the tenant level of all block list rules and the resulting excluded entities across all SAP systems governed by Access Risk Management.
-
Analysis Dashboard - Executive-level overview of the current risk posture to understand where open risks are concentrated, how exposure has changed over time, and enables analysts to determine where to focus remediation efforts.
Important
To enable the Analysis Dashboard in your tenant, you need to explicitly grant the Analysis Dashboard reporting group and either directly assign it to users on the Settings > Manage Users page or create an inheritance for all users assigned to an Access Risk Management permission role on the Settings > Manage ARM Roles page.
Note
Reports can handle a maximum of 250,000,000 materialized permission records, meaning the total combined number of users, risks, business functions, roles, authorization objects, and authorization field values.
Navigating the Online Reports UI
View reports online by going to Online Reports, then selecting a report type. Report sheets have filters or summary cards at the top, widgets in the middle, and full details on the lower portion of the screen. Tooltips for various cards and widgets include a description and sample data from your tenant’s data set.
You can navigate reports using the following options:
Note
Not all options are available on every page.
- Report Sheets
 icon allows you to go to the available report sheets for each type of report. For example, on the User Risk Details report, you can view Risk Summary, Risk Details, or Risk Insights. You can also move between report sheets using the navigation arrows in the upper right corner of each report.
 - Help
 icon brings up detailed information about the current report.
 - Hover over data tables or containers to bring up options at their upper right, including download and full screen mode.
Filtering Online Reports
You can filter the data sets according to your preferences. Some ways to filter include:
- Select any individual text value within a table or chart, then use the filtering context menu that appears in the upper right corner of the visual. Select the check mark
 icon to apply the filter.
 -
Use the filter panes across the top of each report, such as Risk Code, to perform advanced filtering functions on that field.

By default, your cursor will appear between two asterisks, like this: * | *. Start typing to create a Contains filter, move your cursor to the left of the asterisk wildcards for a Starts With query, or move your cursor to the right of the asterisk wildcards for an Ends With query.
Examples:
    - *Payables* would find any value that contains “Payables”
    - Payables* would find any value that starts with “Payables”
    - *Payables would find any value that ends with “Payables”
Selecting the More
 icon on a filter pane displays additional advanced options, such as Select Alternative, which is useful when you want to exclude a defined list of values. Search for and select the values you want to exclude.
 -
Selections Tool
 icon at the upper right opens a page where you can select which data to include on your report sheet from the various filter panes. The top part of the page shows active selections, and the lower part of the page shows available fields that can be used to filter the report data. Select the icon a second time to close this view.
 - Smart search
 icon lets you search this report for specific data. For example, you can paste a delimited list of usernames, role names, or risk codes.
 - Step back
 and step forward
  icons undo or reapply your filter selections. Use them to quickly navigate between filtered states.
 - Clear all filters
 icon clears all applied filters at once. If you select this option accidentally, use the step back icon to reapply your filters.
 -
Bulk Filter - Download a chart, open the downloaded file, then highlight and copy the data you want to include in your filter. Return to your Access Risk Management online report and select the filter pane for the data you copied. For example, if you copied risk codes, select the filter pane titled Risk Codes. In the search field, delete the asterisks, paste your copied data, and press Enter.
Important
Remember to press Enter after pasting your data. If you select the checkmark, the filter will not be applied.
Applied filters appear as blue boxes at the top of the page and can be cleared by selecting the X on the right side of each applied filter.

Customizing Table Layout
Table visuals in the Online Reports can be customized. Default columns may be hidden, resized, or reordered, and optional columns may be enabled.
- To customize a table visual, select the Full screen
 icon in the context menu that appears in the upper right corner of a table visual when you hover over the table. Then right click anywhere on the table and select the Chart exploration
  icon to open the available table configuration options.
 - Use this to customize the table to show only the columns relevant to your analysis. Default columns may be hidden or reordered, and optional columns can be enabled and reordered.
- Select the checkbox to the left of any column name to enable or disable the column.
- Select and drag a column name to reorder the columns.
- Resize any column width using the column drag handles.
Exporting Online Reports
You can download results from any of the tables on the reports to an .xlsx file. To export up to 1 million rows of data, right click on any table visual and select the Download  icon from the available chart options.
Caution
If you hover over a table and then select the Download ![]() icon at the upper right, you will only be able to download an image of the container report. To download the data in an .xlsx file, select somewhere on the table, then outside click to see the chart options. Select from that menu.
icon at the upper right, you will only be able to download an image of the container report. To download the data in an .xlsx file, select somewhere on the table, then outside click to see the chart options. Select from that menu.
To export more than 1 million rows of data, go to the Activity History page and select Analyses. Refer to Exporting Risk Analysis Data.
Bookmarking Layout Preferences and Filter Selections
Use the Bookmarks option to create and manage stored views for you preferred layouts and filter sets. You can save filters only, or both filters and layouts.
- Select the Bookmarks
 icon in the upper left corner of any report to open the Bookmarks pane.
 - Select + Create new bookmark to create a bookmark or you can choose from a list of available bookmarks to switch to that view.
Important
Select Save Layout to retain any layout changes you made while using the chart exploration options, otherwise the bookmark will only save the applied filters.
Tip
Use naming conventions for your bookmarks that make it easier to return to them.
Verifying the Security Analysis Used in Online Reports
Below the filters, you can find the security analysis, system, and date that are the current source of your analysis and reporting data. Select the expand arrows to see a larger view of this information.
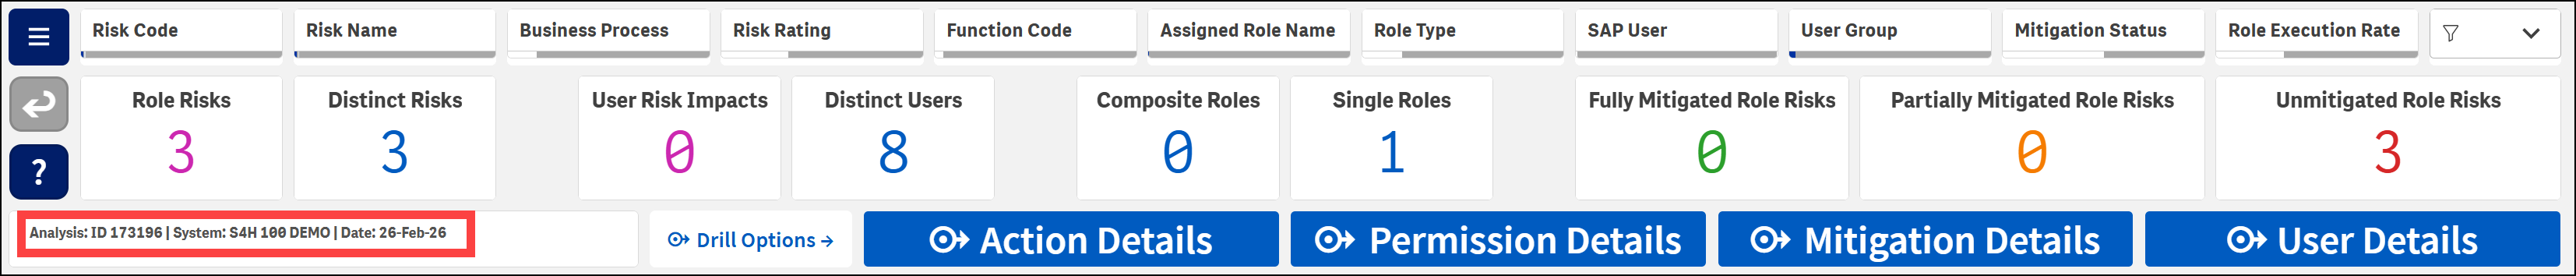
To view a security analysis, go to Activity History > Analyses. Refer to Exporting Risk Analysis Data.
Documentation Feedback
Feedback is provided as an informational resource only and does not form part of SailPoint’s official product documentation. SailPoint does not warrant or make any guarantees about the feedback (including without limitation as to its accuracy, relevance, or reliability). All feedback is subject to the terms set forth at https://developer.sailpoint.com/discuss/tos.