Test Connection Detailed View
To see more detailed information about the status of a specific application, select the more options button within the Actions column.
-
Select Test Connection.
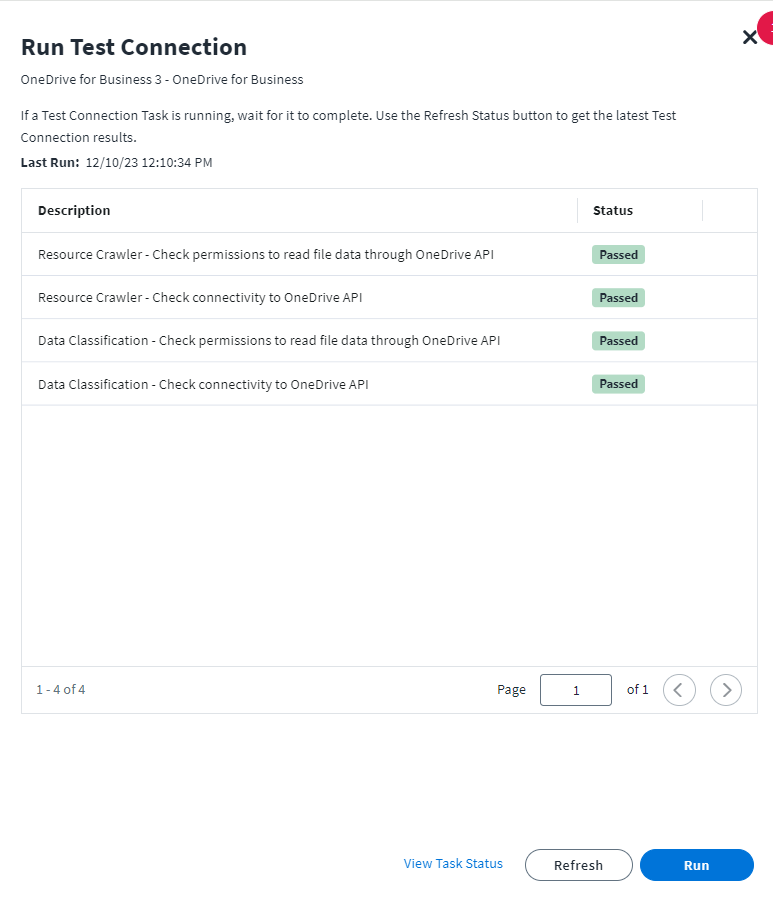
A new overlay will display providing further information as to the configuration status of the application.
- All tasks associated with the application that were run displays in the Check Name column
- The status of the connection status displays in the Status column:
- Passed – the configuration of the application was successful.
- Failed – the configuration of the application was not successful. A dialog displays providing a reason and/or a suggestion on how to fix the issue.
- Warning – a pop up will display with an explanation of the error and a recommendation for solving the issue.
If any task fails or has warnings, an information icon displays to the right of the Status column. Click the information icon to see the reason for the failure and a recommendation on how to fix it.
Note
If any task fails within the application configuration, the whole test connection will fail, which displays on the main Application page.
There are three buttons at the bottom of the overlay that the user can select:
- Run – runs the test connection task
- Refresh – refreshes the grid and displays the latest results
-
View Task Status – takes the user to the task screen and displays the relevant task
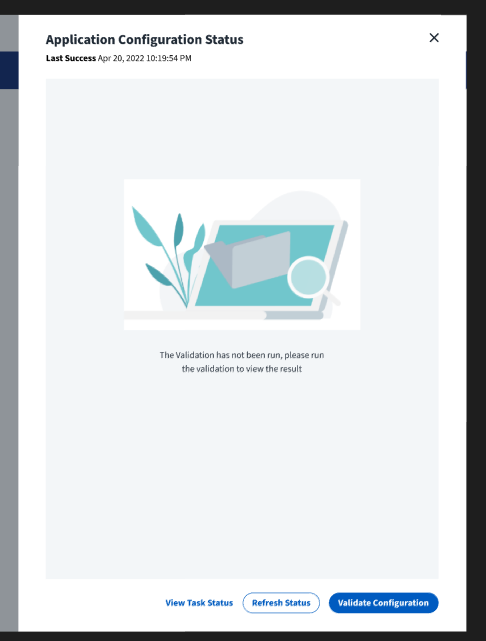
If a test connection task has not been run on a specific application, the overlay will be empty.
Documentation Feedback
Feedback is provided as an informational resource only and does not form part of SailPoint’s official product documentation. SailPoint does not warrant or make any guarantees about the feedback (including without limitation as to its accuracy, relevance, or reliability). All feedback is subject to the terms set forth at https://developer.sailpoint.com/discuss/tos.

