Data Tab
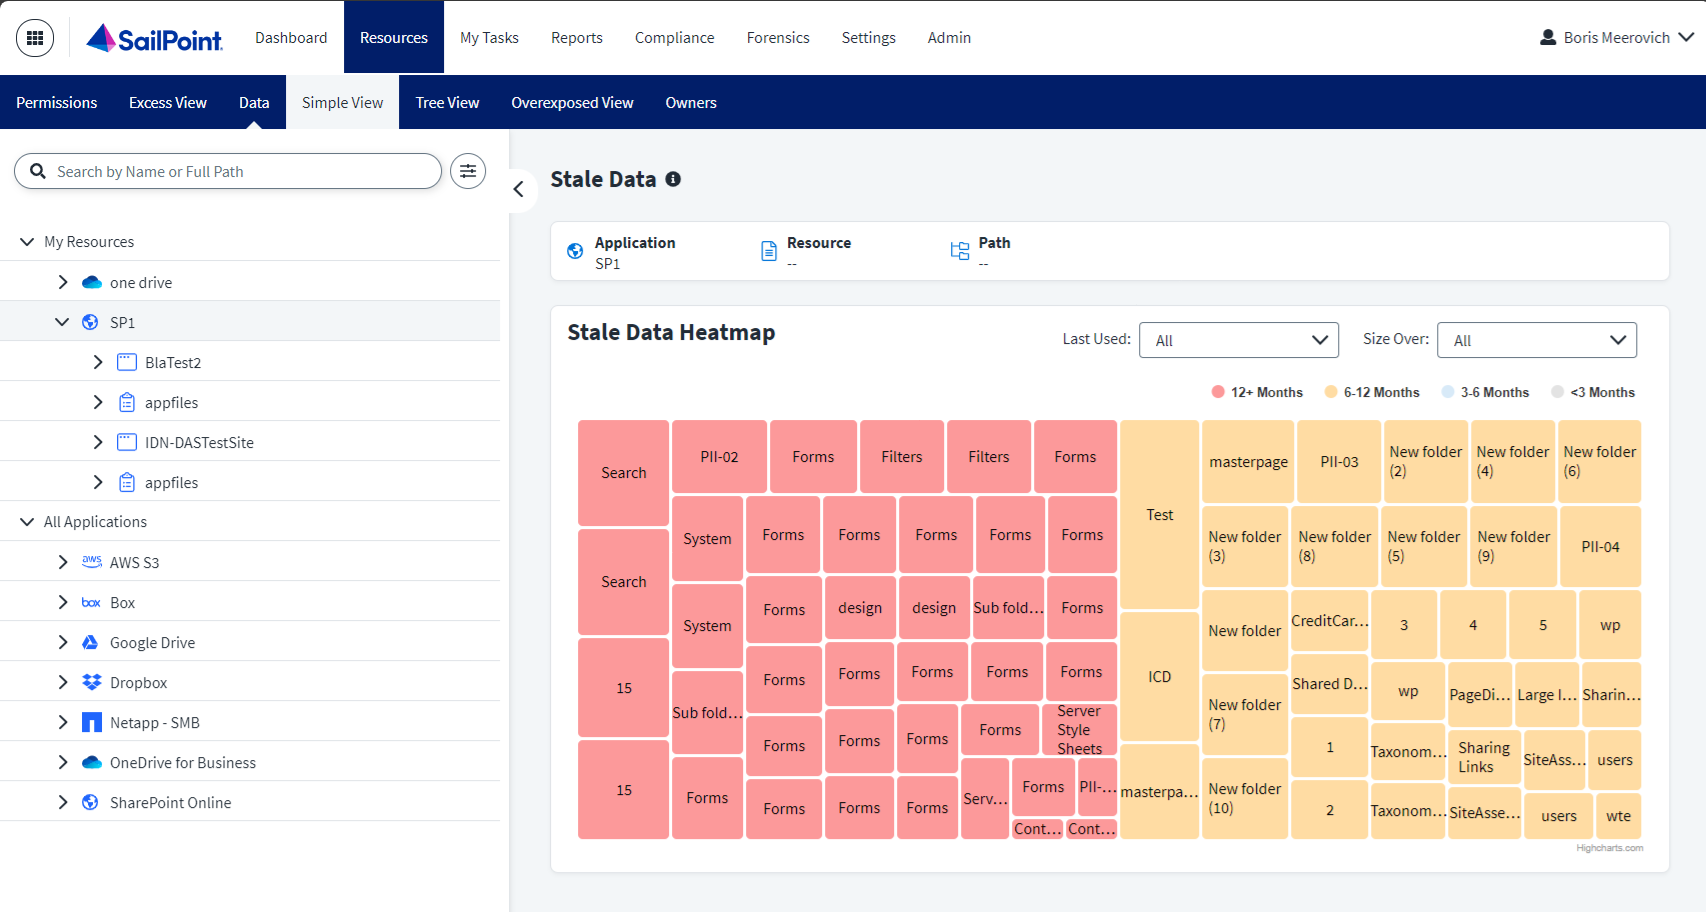
This tab helps identify the data distribution and staleness levels from within a certain resource.
Each color-coded block represents a nested resource. Usage information is aggregated and presented based on the most recent data.
Resources are color-coded in a heatmap based on the last time they were accessed, which represents their staleness. Above the heatmap, a legend depicts the time frames that determine the mapping.
Stale data is calculated by the following flow:
- Most recent activity collected on the resource (must have Activity Monitoring enabled for the application).
-
Most recently modified date or accessed date of the business resource from metadata collected during the crawl.
Note
Data Access Security cannot collect last modified and/or last accessed for all business resources. It is highly recommended that Activity Monitoring is enabled for best results.
-
The first time the business resource was seen by Data Access Security.
Note
The size of the block indicates the size of the resource. If a resource has a zero for size, it will not display.
Clicking a block provides the user with a snapsnot of information regarding that resource like the type of content within the resource, if there is sensitive information in the resource, and who owns the resource. For more information on that selected resource, select View Details.
After selecting View Details, you can select between two tabs on the View Details window.
Note
The info presented in the View Details window reflects the main resource, not the sub-resources.
- General tab - provides the same type of info that was presented when the resource block was selected from the heatmap.
- Data Analysis tab - gives a visual of the sensitive data and content types that are stale within the selected resource.
Filtering
Filter the resource blocks by either the last time the resource was used or by the size of the resource.
Documentation Feedback
Feedback is provided as an informational resource only and does not form part of SailPoint’s official product documentation. SailPoint does not warrant or make any guarantees about the feedback (including without limitation as to its accuracy, relevance, or reliability). All feedback is subject to the terms set forth at https://developer.sailpoint.com/discuss/tos.