Understanding Dashboards
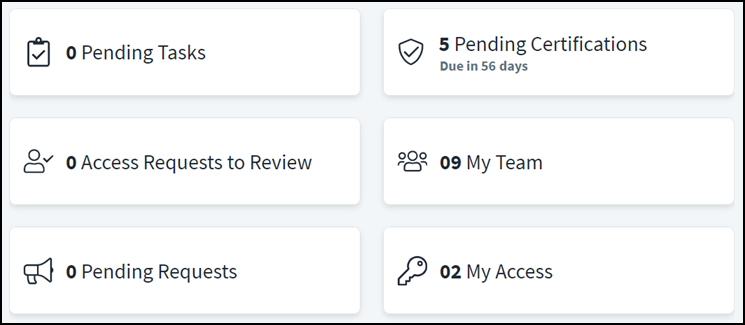
After you've signed in to your account, you'll be taken to the home dashboard. Here, you can see the panels that can help you track your work and access. These panels, called tiles, display information related to you and your work.
By default, a small set of tiles are displayed. You can add or remove tiles from your home dashboard to view the information most relevant to you.
Using Your Home Dashboard
You can edit which tiles appear on your home dashboard so that it reflects the things that matter to you.
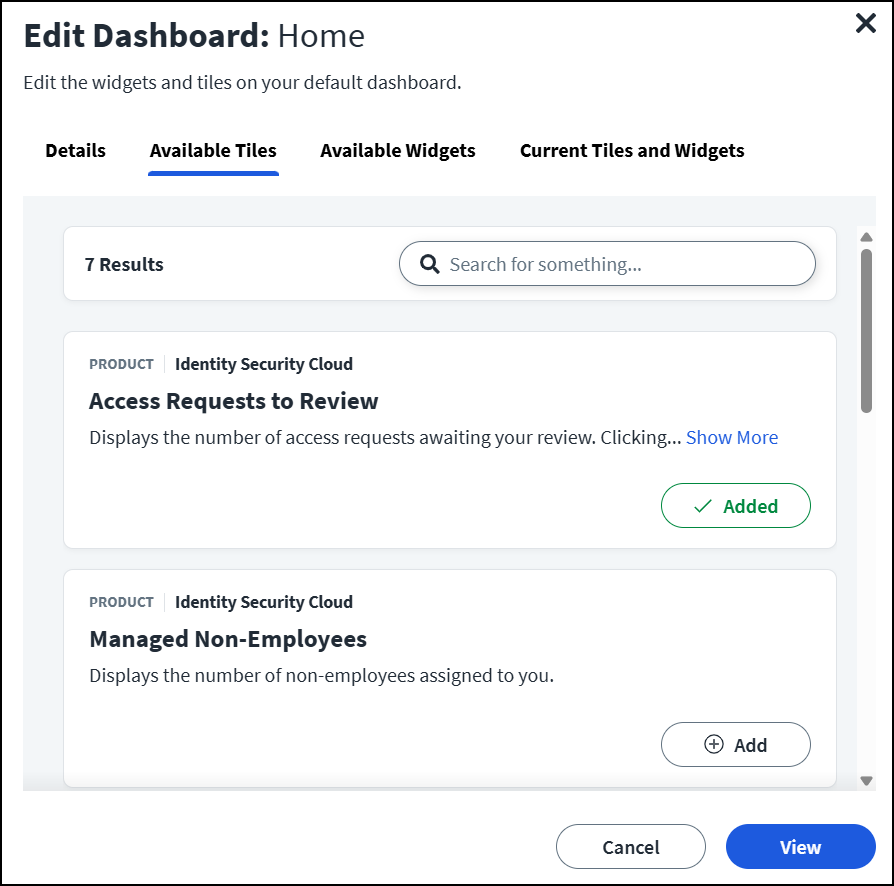
To add or remove tiles:
-
From the home dashboard, select the Edit Current Dashboard icon
 in the upper right corner.
 -
On the Available Tiles tab, select the + Add button beside the tiles you want to add to this dashboard.
-
On the Current Tiles tab, select Remove to remove a tile from your home dashboard.
Your dashboard is saved automatically and updated based on your selections.
Note
The Available Widgets tab will be empty. Widgets are applied by admins to managed dashboards.
-
On your home dashboard, drag and drop the tiles on this page to reorder them.
If you're also an administrator, you can see additional tiles and widgets based on the features you use in your tenant. Refer to Audit Reports and Monitoring for details about the other information you might see on the home dashboard.
Using Managed Dashboards
In some cases, your administrator might assign additional dashboards to you based on your access. These managed dashboards contain widgets that provide detailed information about specific types of activity in your system.
Note
Managed dashboards can't be edited or reordered.
To view a managed dashboard:
-
Select the dropdown list beside Current Dashboard on the home dashboard.
-
Select the dashboard you want to view.
The managed dashboard and its associated widgets are displayed.
To change the default dashboard, open the Current Dashboard dropdown list and select the Mark as favorite icon  to set which dashboard is displayed when you sign in or refresh the page. Only one dashboard can be marked as your favorite.
You can also:
- Select the Menu icon
 beside the graph on a widget to view additional options for the data in the widget. For example, you can export the chart as a .csv file, download it as a .png file, or view it in full screen.
 - Select the label beside a legend to hide or show data in a pie chart.
Now that we have you set up, let's get you the access you need.
Documentation Feedback
Feedback is provided as an informational resource only and does not form part of SailPoint’s official product documentation. SailPoint does not warrant or make any guarantees about the feedback (including without limitation as to its accuracy, relevance, or reliability). All feedback is subject to the terms set forth at https://developer.sailpoint.com/discuss/tos.