Viewing the Status of Your Cloud Infrastructure
Cloud Access Management displays your entire cloud infrastructure across the cloud sources and subscriptions you've configured it to access and govern.
Select Dashboard in the left menu to view a summary of the current security and compliance status for your cloud infrastructure.
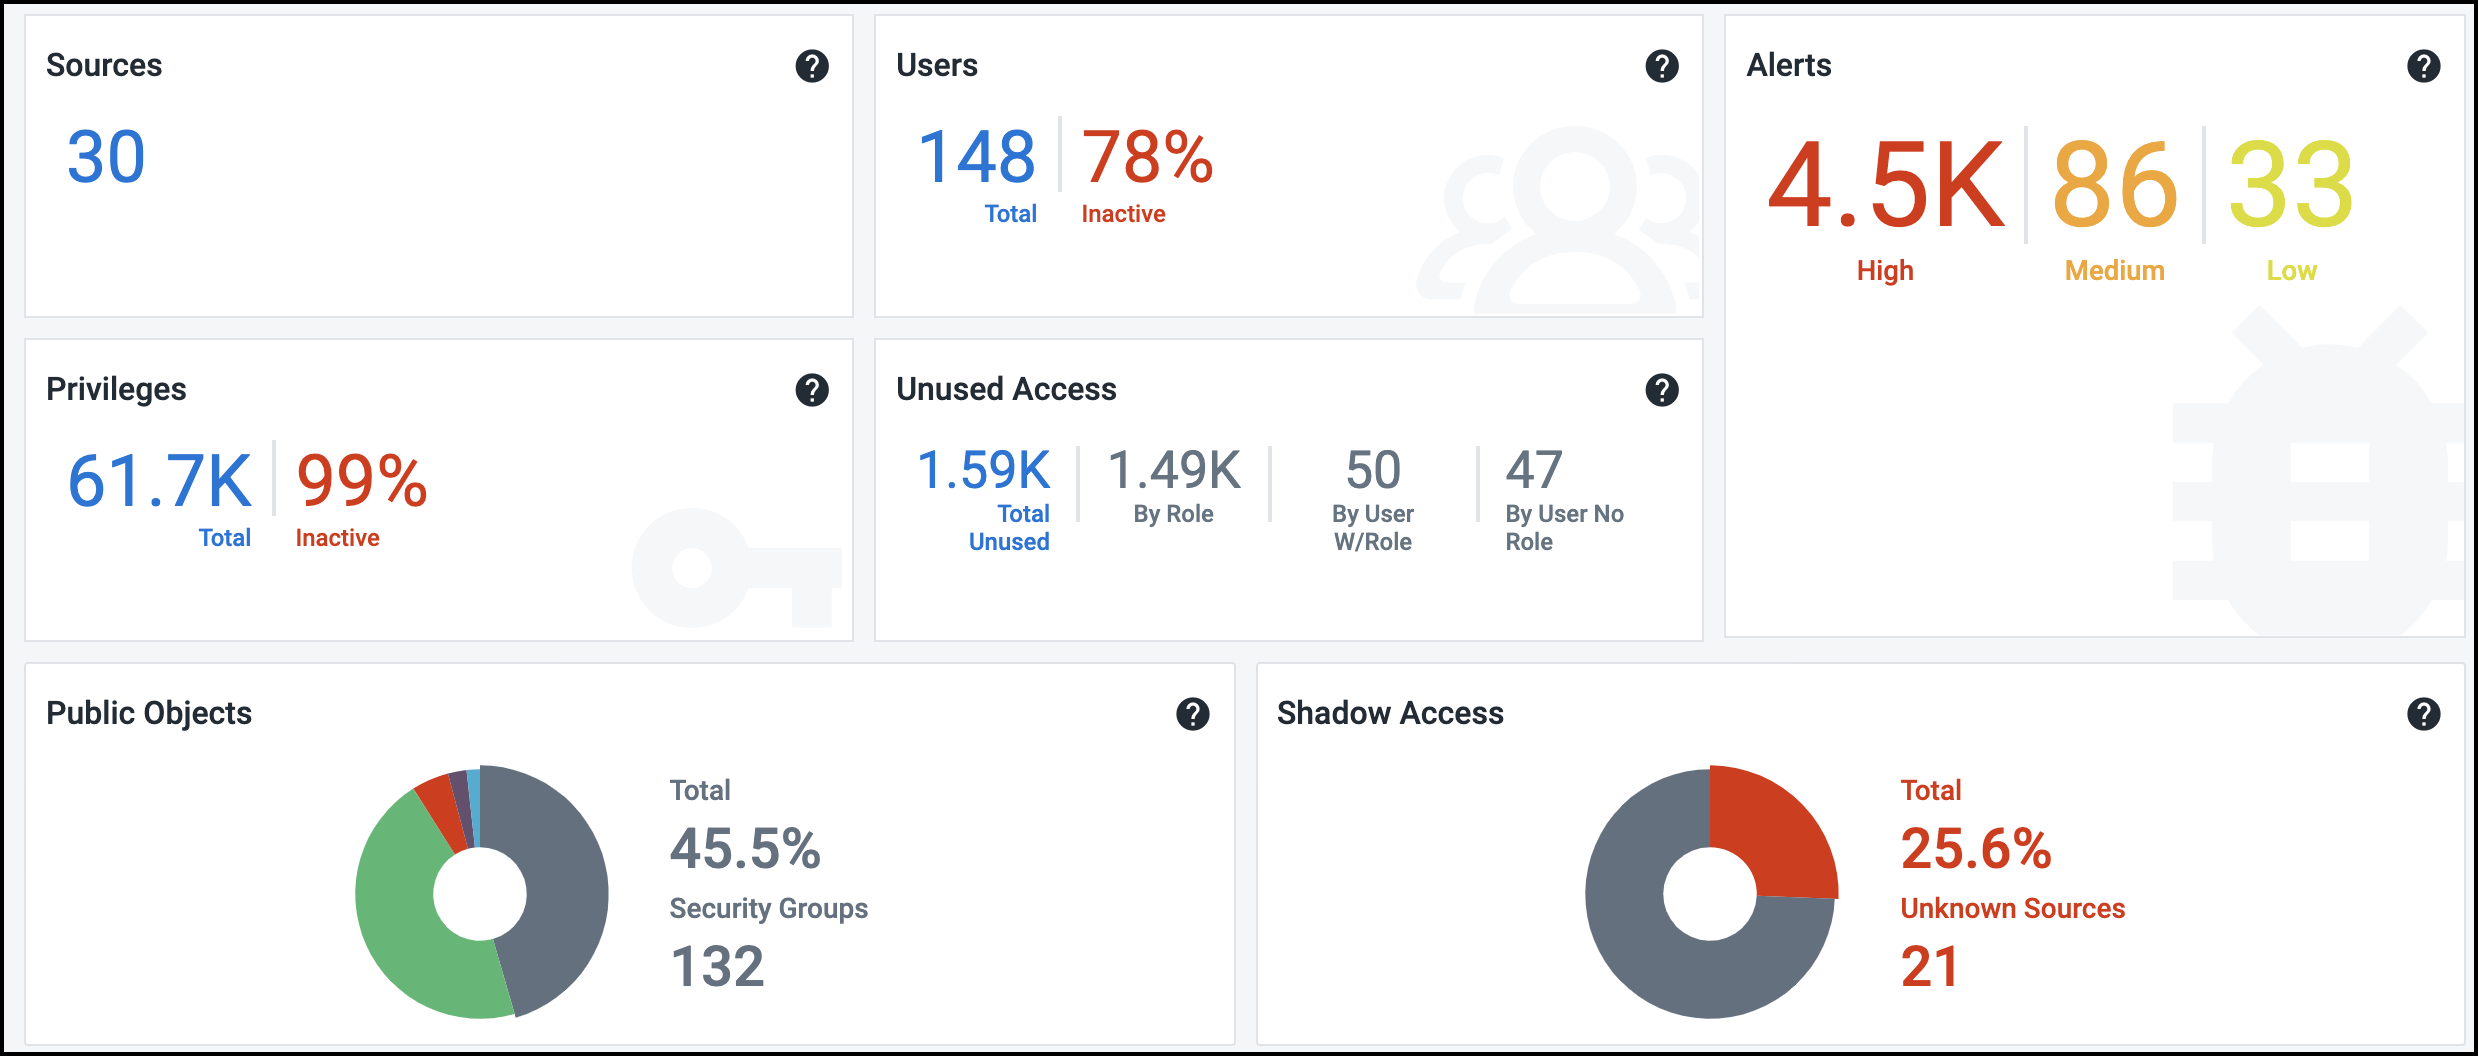
Status information is organized into tiles based on the data accessible to Cloud Access Management.
Viewing Sources Status
This number refers to the total number of cloud sources being governed, and can therefore be a combination of Amazon Web Services accounts, Google Cloud sources, and Azure subscriptions. If an account is unknown, it will display in the Unknown Source section of shadow access.
For more information, refer to Working with Sources.
Viewing User Status
These numbers represent the total number of user identities discovered across cloud sources, including service accounts, security principals, groups, and privileged users, as well as the percentage of these users who are currently inactive.
Inactive users can pose a security threat, as their credentials can be more easily compromised and used to gain unauthorized access to your cloud infrastructure.
Viewing Privileges Status
These numbers represent the total number of privileges available for performing operations across cloud sources, as well as the percentage of these privileges that are currently inactive or unused/excess. Each cloud platform has thousands of privileges that Cloud Access Management monitors and analyzes.
Privilege abuse and escalation is a leading attack vector for insider threats and targeted attacks. To minimize risk, it is therefore essential to maintain least privilege in cloud environments.
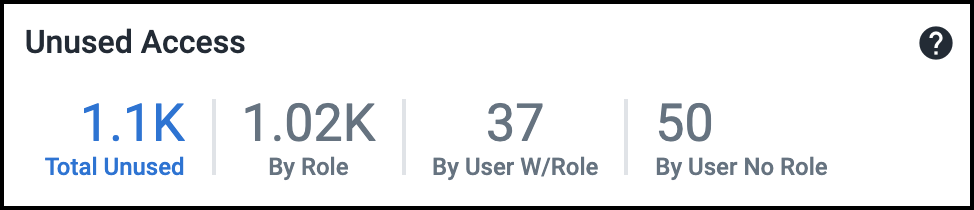
Viewing Unused Access Status
These numbers show the total sensitive access across cloud sources that have not been used for the past 90 days. This is divided by roles, users, and direct IAM user access without roles. This includes unused access provided by services as well. For more information, on viewing and managing unused access, refer to Viewing Unused Access.
Viewing Alerts Status
This tile provides the current count of alerts based on their severity. Select this tile for a detailed view into these alerts. For more information, refer to Viewing and Triaging Alerts.
Below this top set of tiles are two pie charts that summarize the publicly accessible objects in your cloud infrastructure, as well as the external sources that can currently access them. Because they can represent a significant security risk, Cloud Access Management also identifies sources with privileged or admin-level access to objects or data on your cloud infrastructure.
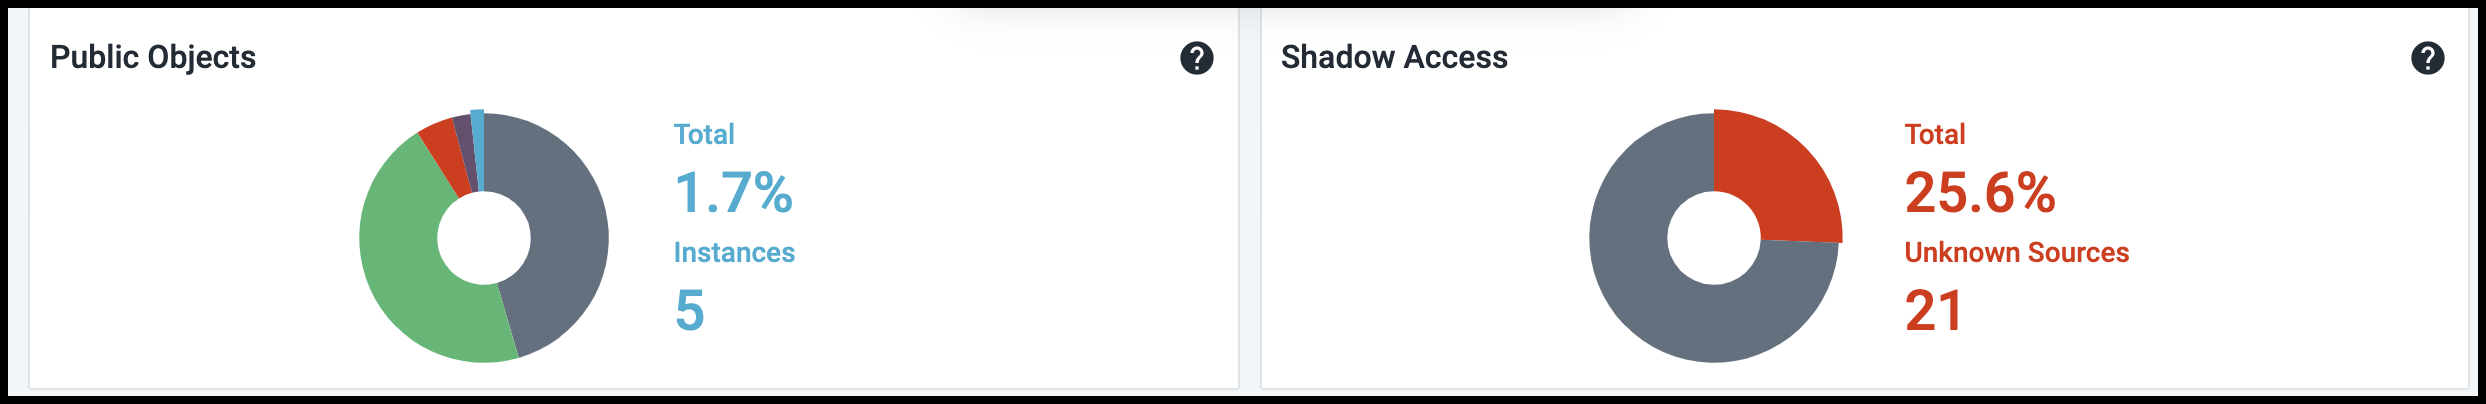
Hover over a colored section of the pie chart to display the actual numbers associated with that piece of the whole. For example, here are the values for the other segments of the Public Objects pie chart:
Viewing Public Objects Status
This pie chart provides a combined view of publicly accessible objects in the cloud infrastructure. Select this tile to view a detailed list of all public objects by type.
Select the name of each type of object listed - instances, object stores, relational databases, security groups, or subnets - to filter the list by that type.
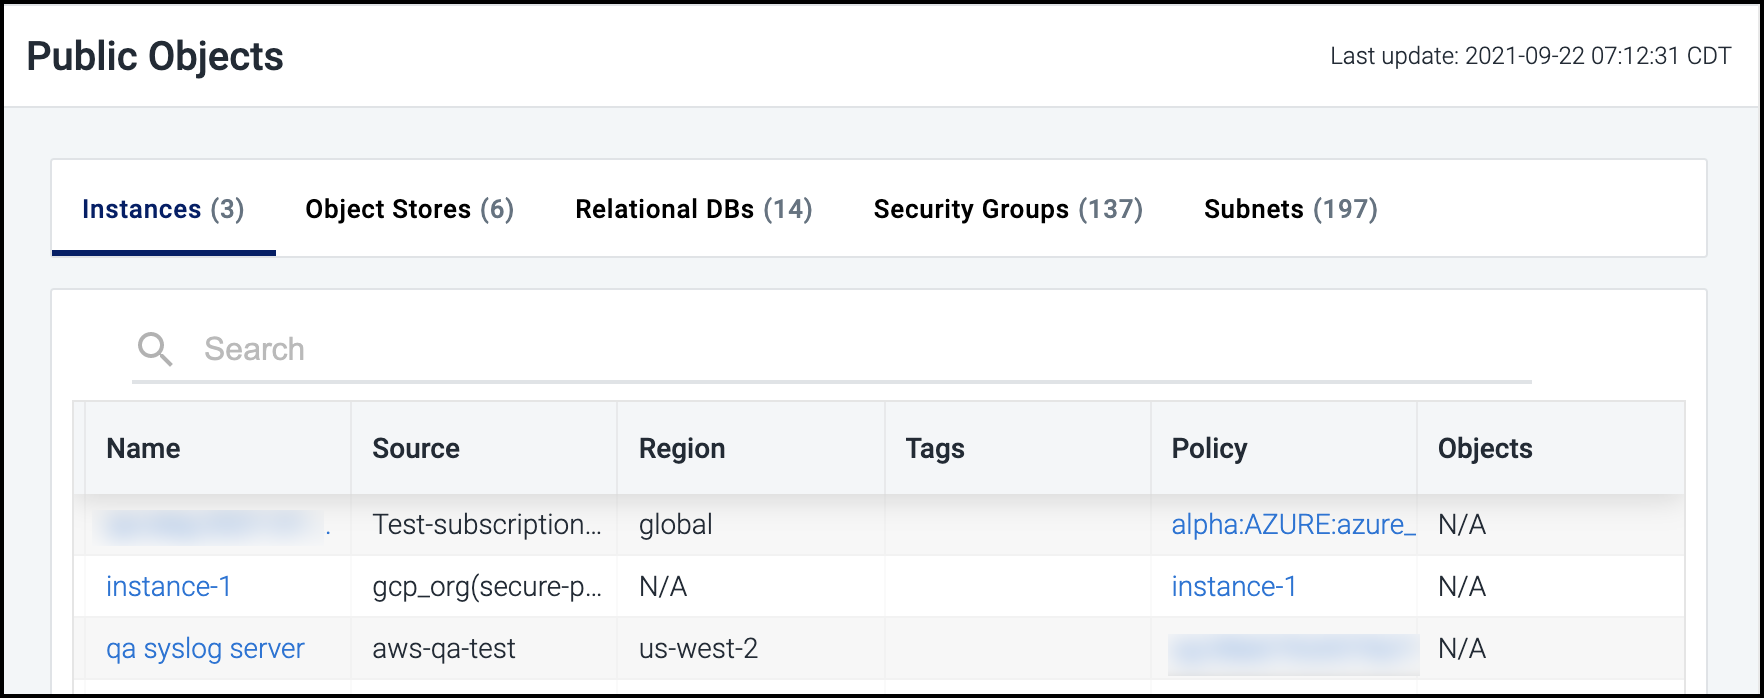
You can also select the name of an item in the list to view additional details about that specific item in its associated section of the Cloud Access Management portal (e.g., object stores or relational databases).
Viewing Shadow Access Status
This pie chart displays the external sources and identities that Cloud Access Management has identified as having unauthorized or shadow access. Cloud Access Management analyzes access to every object in your cloud infrastructure and detects unauthorized access from external cloud sources and external networks that have access to your data.
Select this tile to view a detailed list of all shadow access by type. Select the heading for each type of access listed (UNKNOWN SOURCES, KNOWN SOURCES, SHADOW NETWORKS) to filter the list by that type.
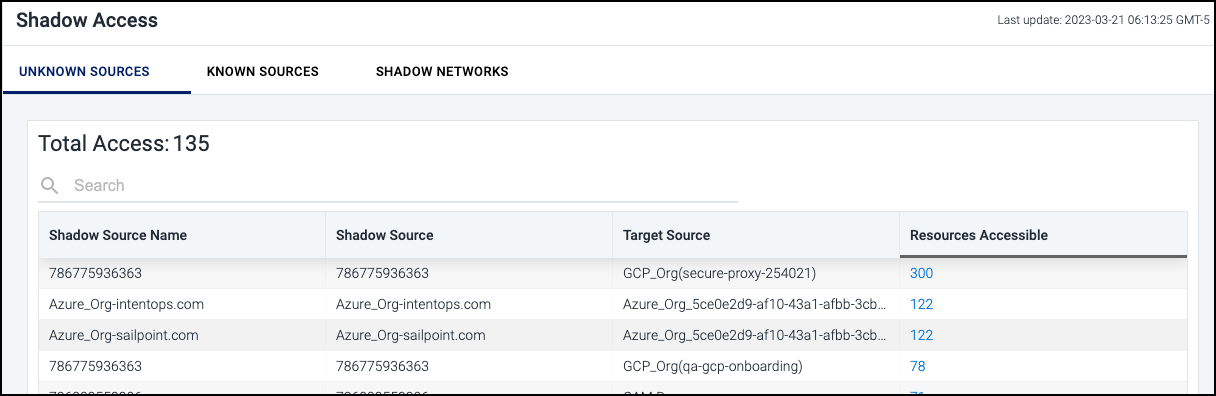
Select a hyperlinked number under Resources Accessible to view all details captured regarding the total access paths for the item.
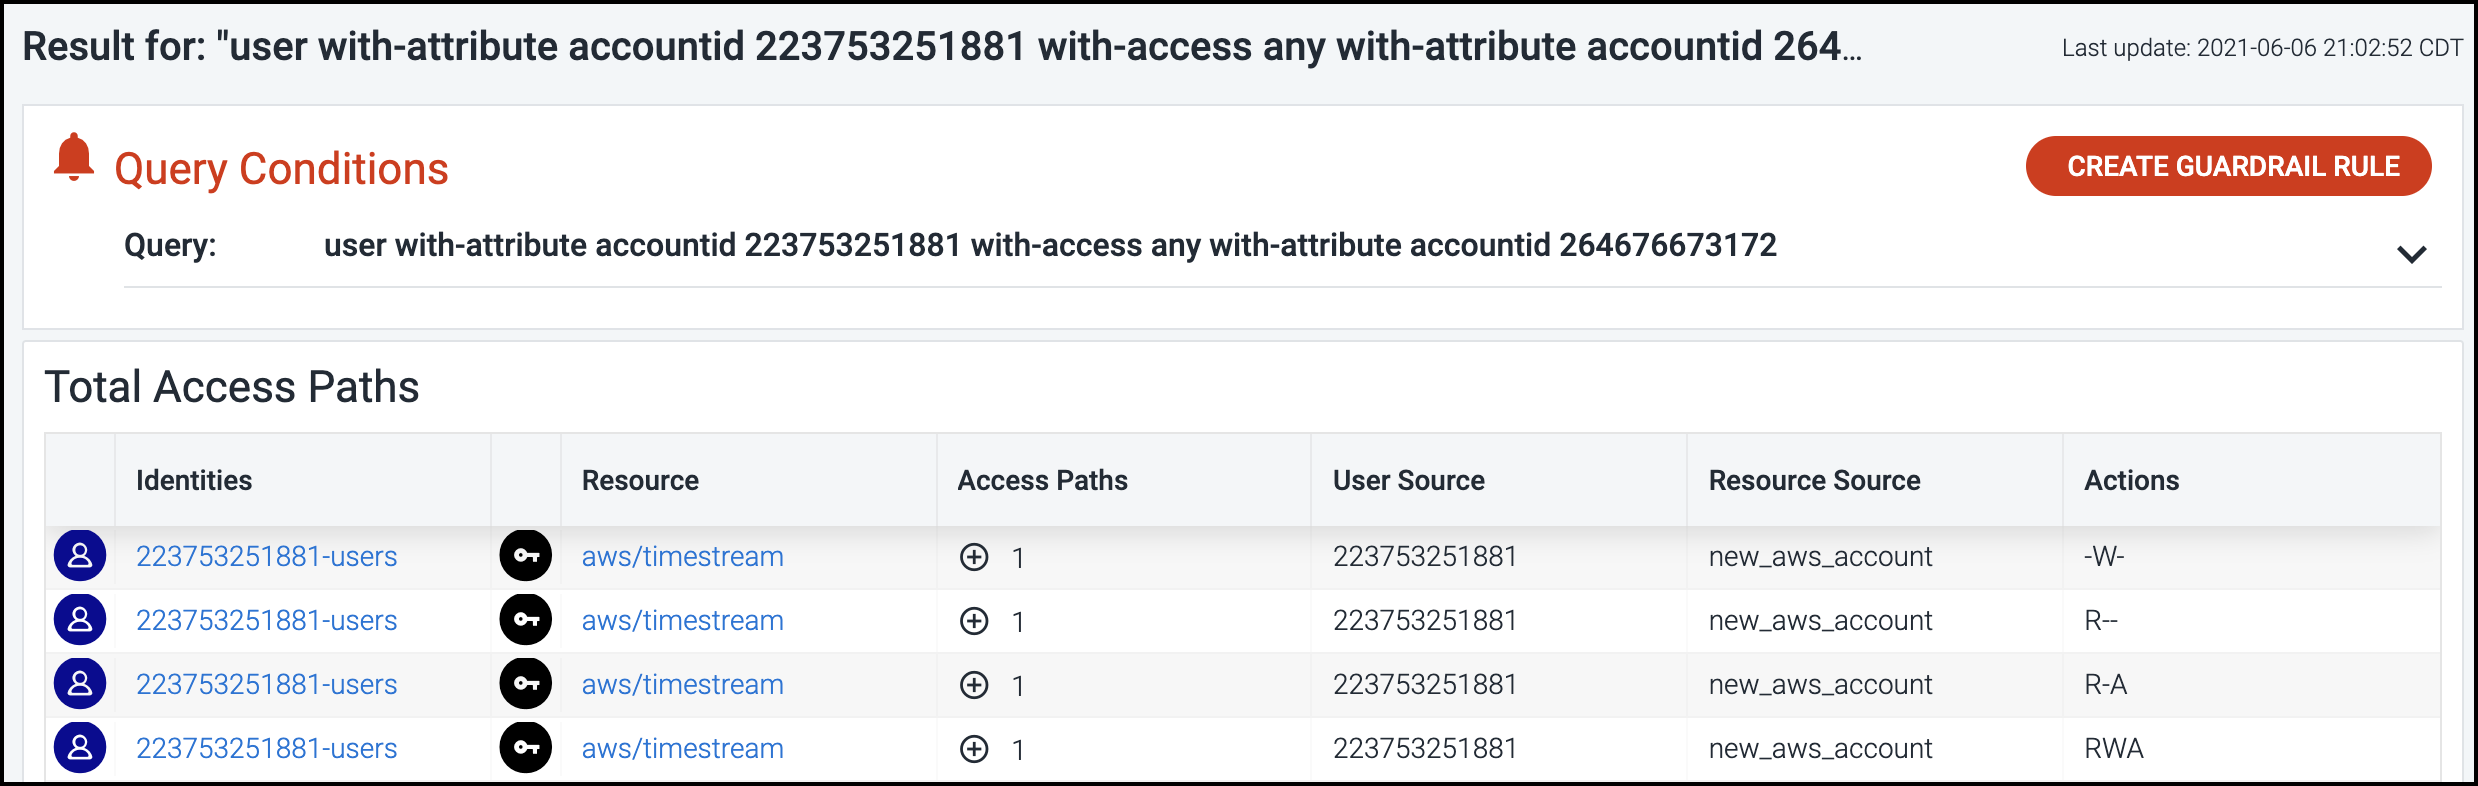
The query used to search the system and generate these results is also provided, so you can easily use this query as the basis for a guardrail rule. For more information, refer to Using Search Queries and Guardrails.
Viewing the Location Map
At the bottom of the dashboard, the location map provides a visual representation of critical security issues and compliance risks on your cloud infrastructure across regions.
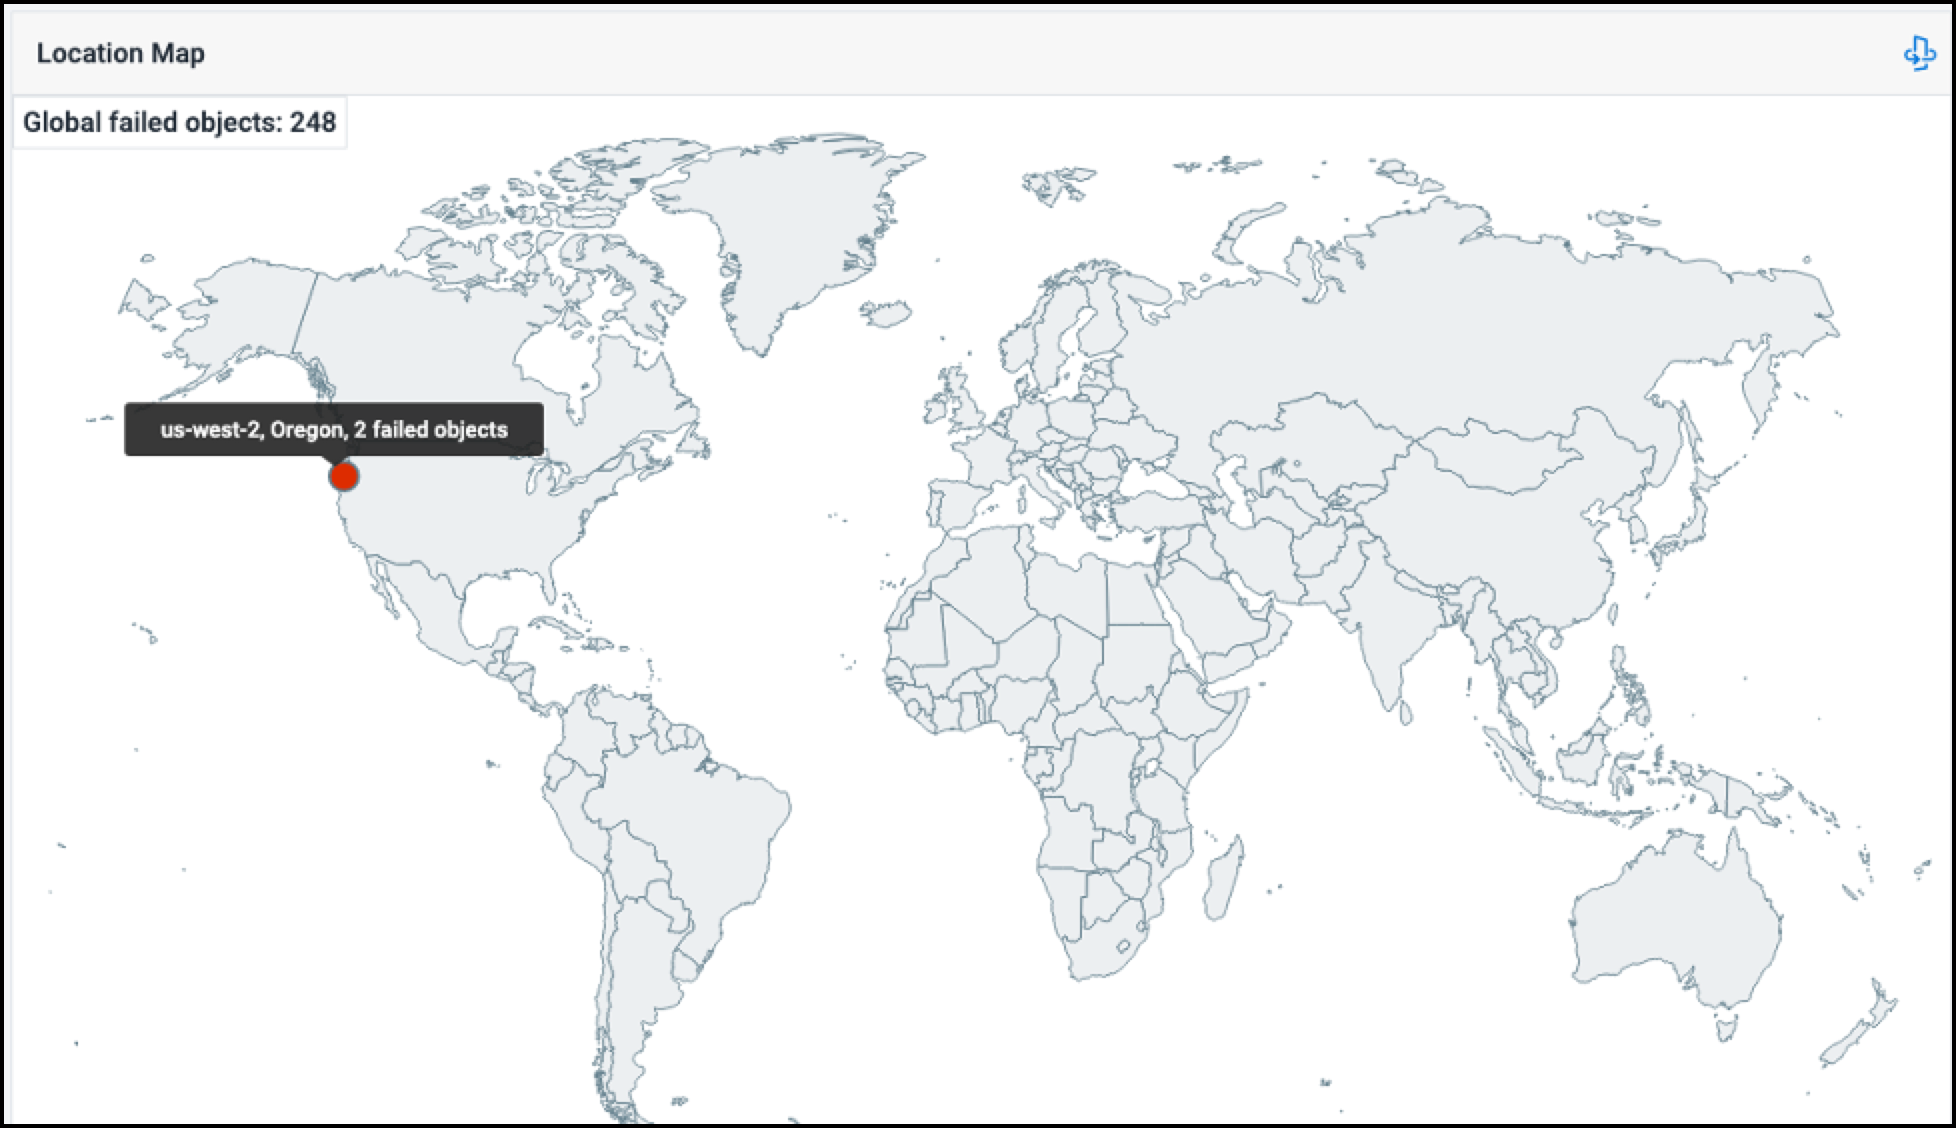
If there's a red circle on the map, you can hover over it to the exact location and number of resource objects involved in generating the alerts.
Select a red circle to open the Alerts page for more details about the associated alerts. For more information, refer to Viewing and Triaging Alerts.
You can also select the Change View ![]() icon to view an
Access Graph that visually depicts the cloud infrastructure related to
the alert.
icon to view an
Access Graph that visually depicts the cloud infrastructure related to
the alert.
Viewing the Access Graph
When viewing the Access Graph, you can select an item in the graph to display identifying details.
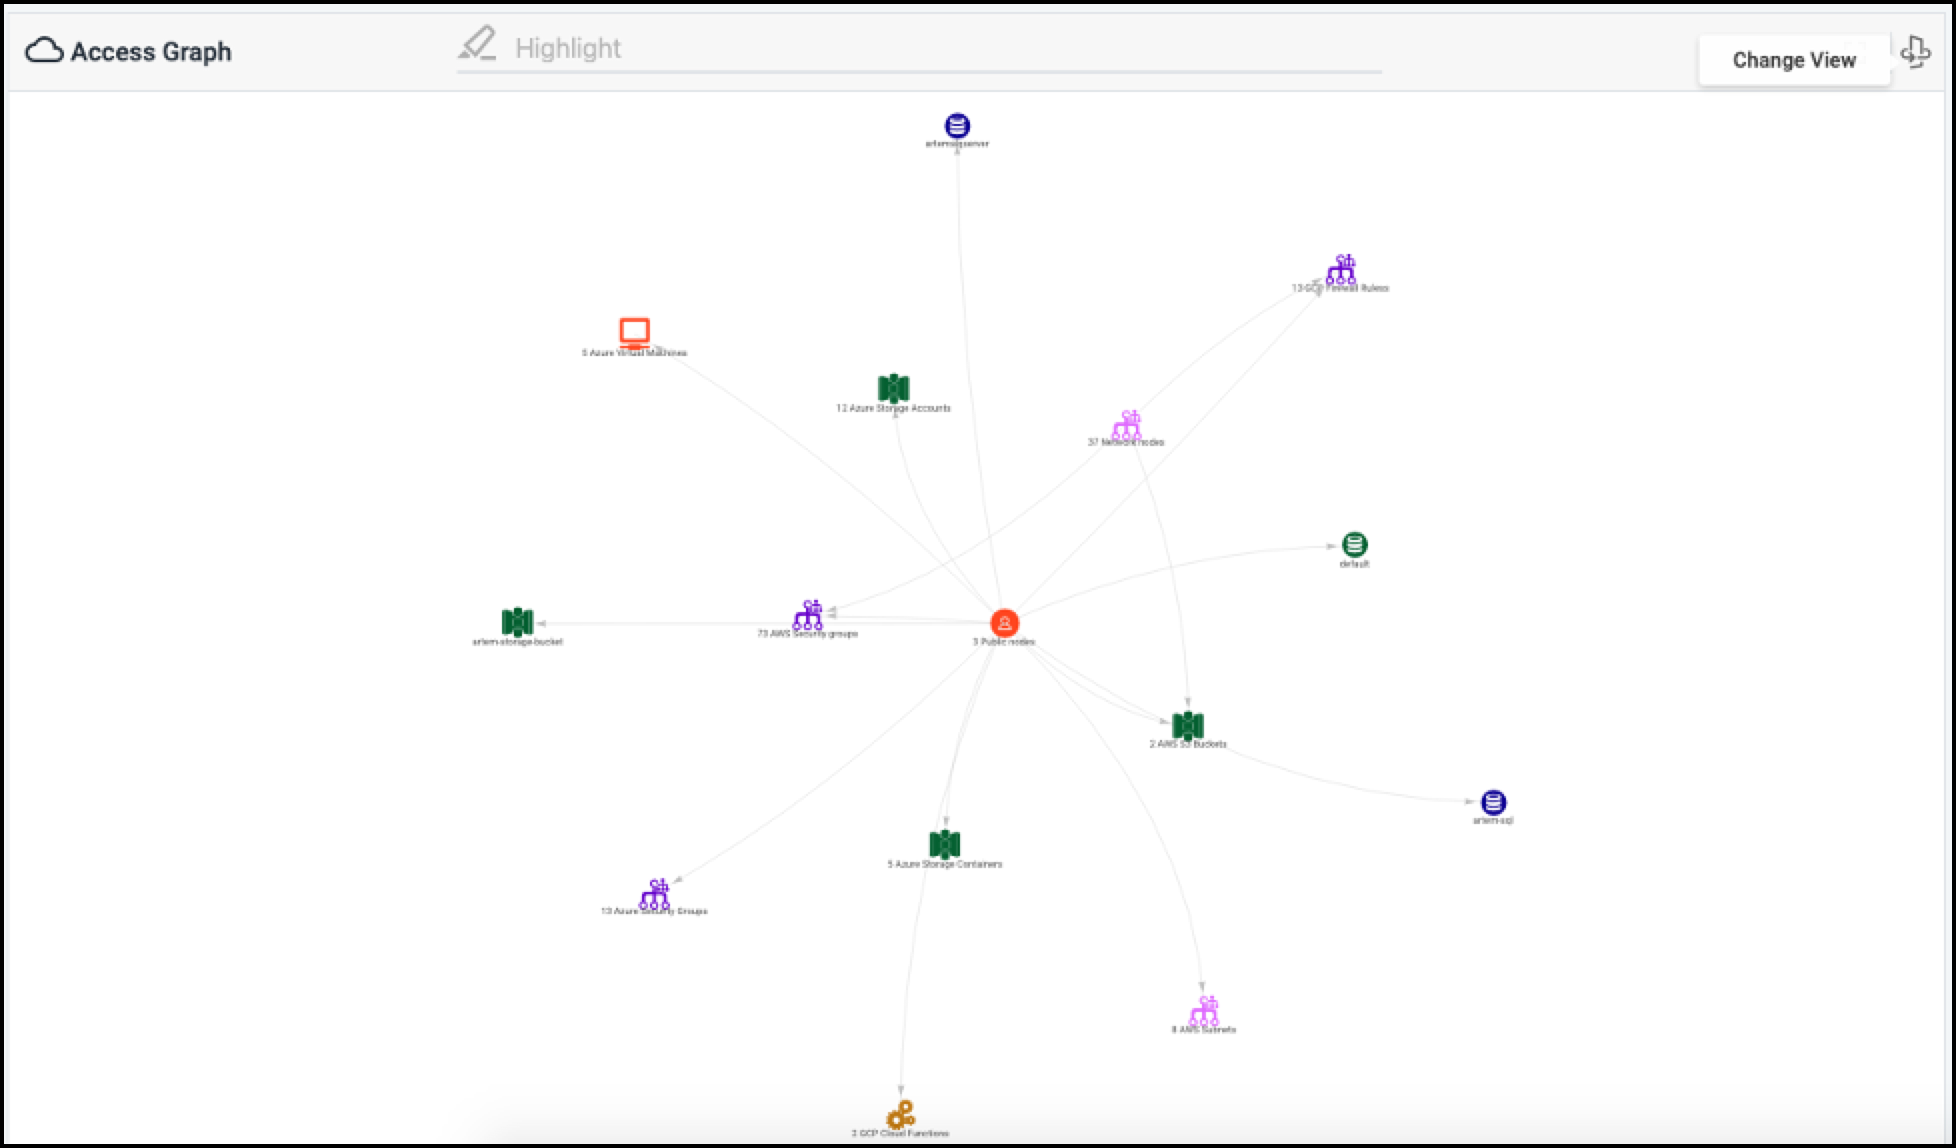
If there are additional details available for the item, you can select OPEN DETAIL PAGE to view more details about the infrastructure object. For more information, refer to Working with Discovered Objects.

Refer to Using the Access Graph to Understand Relationships for more information.
Filtering Your View
By default, the Cloud Access Management Dashboard displays an aggregate of information available for all cloud sources it's configured to govern to provide a complete view.
To view information for a single cloud source, select the Filter icon ![]() and select the specific cloud source you want to view.
and select the specific cloud source you want to view.
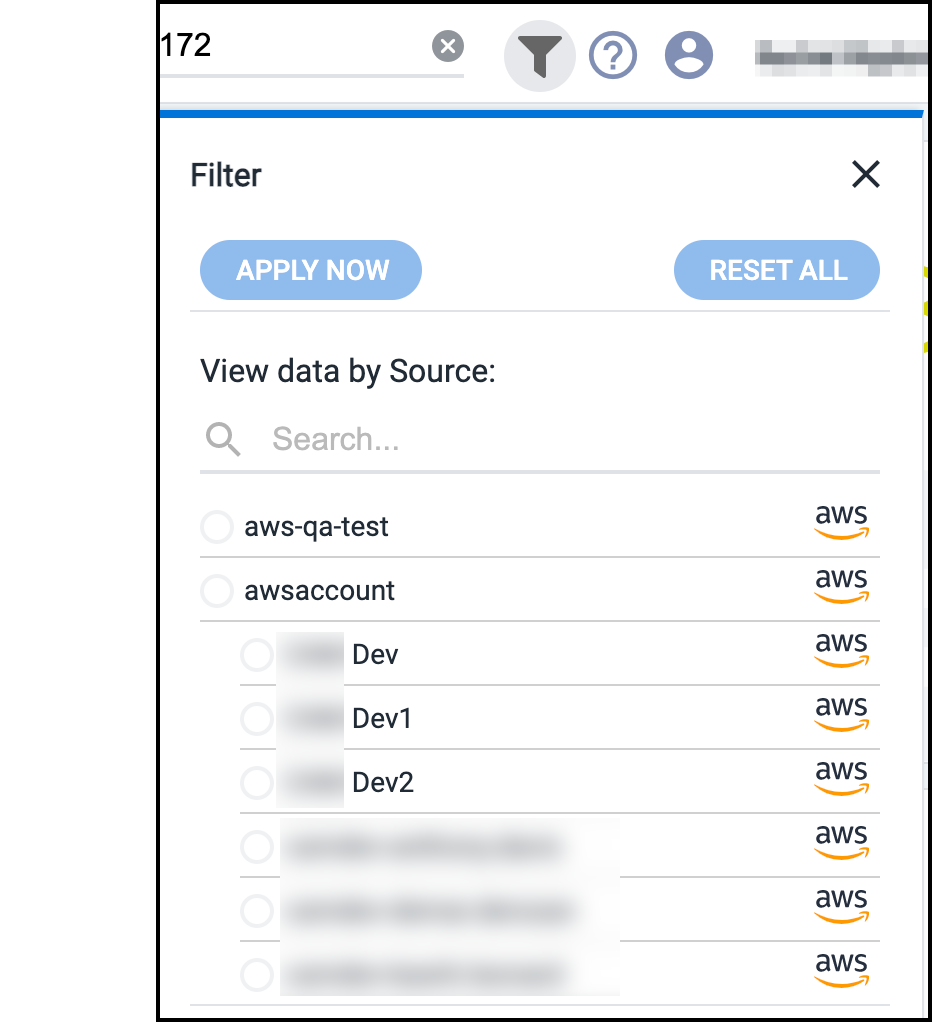
Select APPLY NOW to update the information in the Dashboard based on your selection.
When you're done reviewing the information for that cloud instance, you can select a different one in the list or select RESET ALL to reset the Dashboard to the default view.
Documentation Feedback
Feedback is provided as an informational resource only and does not form part of SailPoint’s official product documentation. SailPoint does not warrant or make any guarantees about the feedback (including without limitation as to its accuracy, relevance, or reliability). All feedback is subject to the terms set forth at https://developer.sailpoint.com/discuss/tos.