Insights Overview
Use the Insights page to understand the trends, behaviors, and potential risks that affect the identity security of your organization.
Insights are displayed on your home page, providing you with an overview of actor and target activity for the past 24 hours. You can access the Insights panels from any page by selecting Insights from the navigation menu.
Exploring Insights
The Insights page consists of information panels, accessed from the following tabs:
- Trust - Overview and statistics related to policy-based trust, including trust scoring based on actors, sessions, and locations.
- Access - A high-level overview of activity over time with view of actors and targets by activity and failures.
- Actors - Insights into actor activity and risk, highlighting dormant, recently discovered, and return-to-life accounts.
- Targets - Insights into target activity and risk, highlighting the most active and most widely accessed targets.
- Location - A map of activity by geolocation, allowing location-based search of selected activity.
You can explore these panels to identify areas of weakness, misconfigurations, and other opportunities for improvement. These discoveries may include unusual changes in access patterns, unexpected failure rates and reasons, dormant user accounts, and risky activity.
Trust Panel
The Trust Panel provides high-level metrics and statistics on the state of trust across your environment. You can use this panel to identity low-trust sessions and view trust scores. When you access the Insights page, the Trust Panel is the default panel.
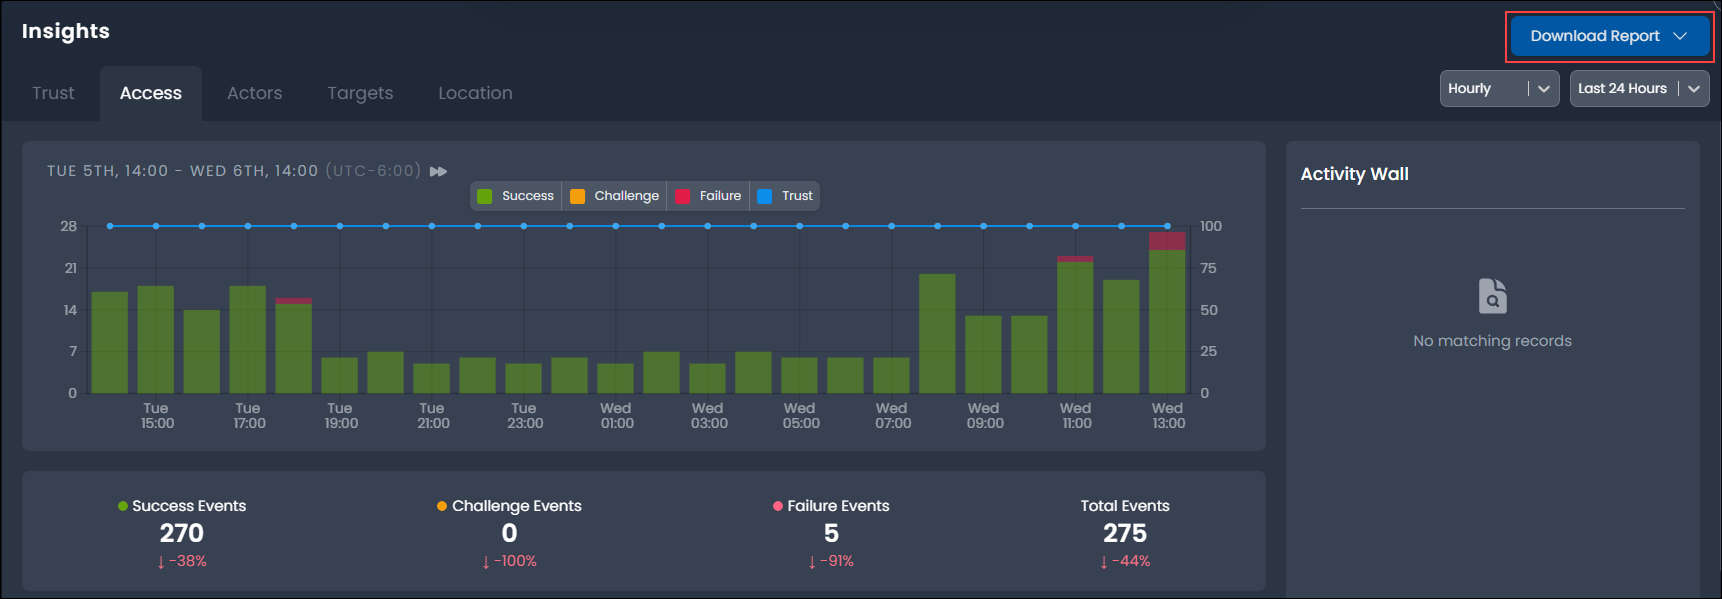
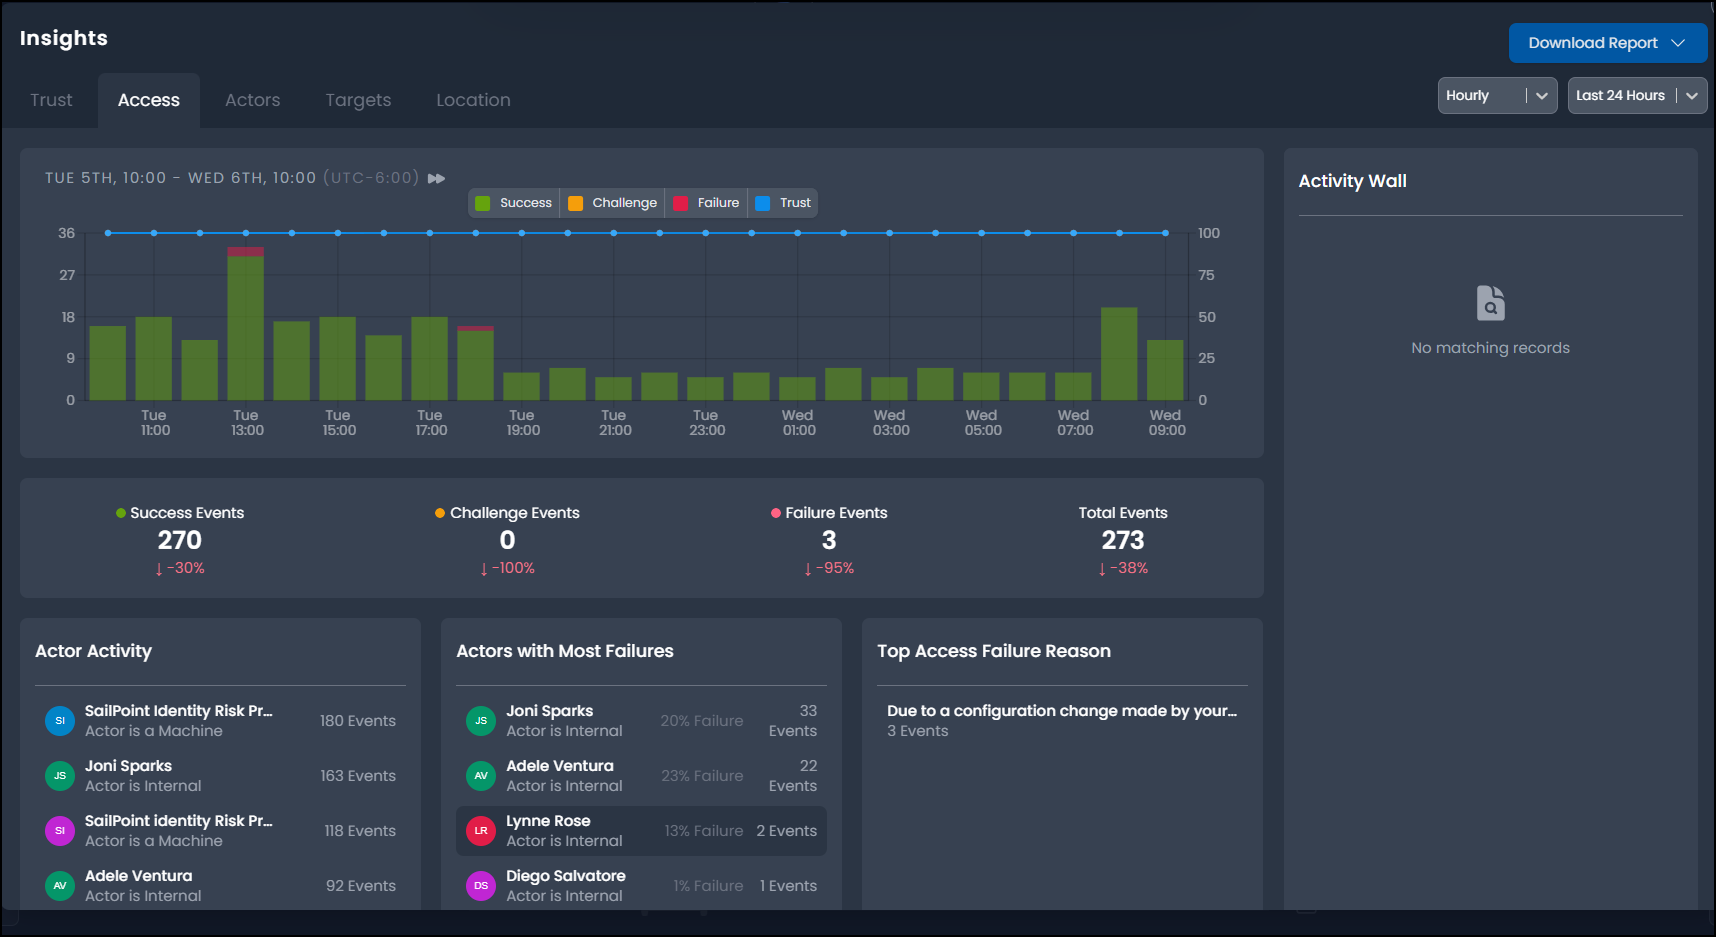
Access Panel
The Access panel provides a timeline of event activity with highlights of the top actors and targets by activity and associated failures.
This view shows activity trends, related event outcome statistics, and the key actors and targets contributing to this activity.
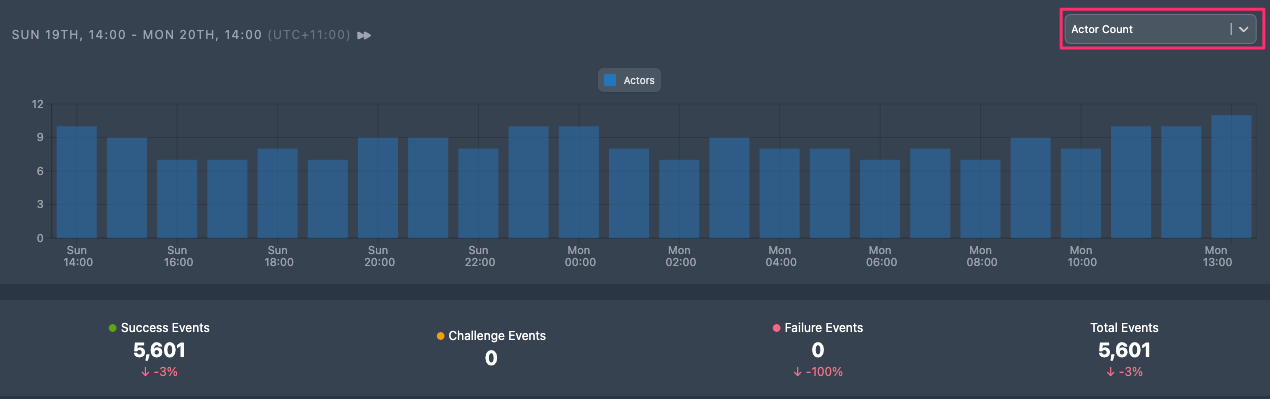
Activity Timeline and Outcome Statistics
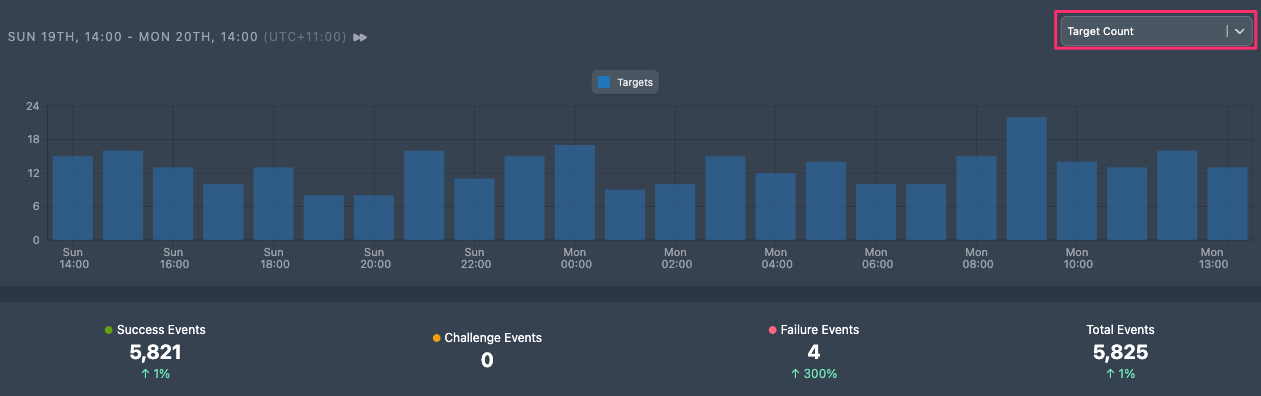
The Activity Timeline provides a chart of activity over a selected time period, highlighting trends in activity and the outcomes of events. The outcome statistics provide detailed counts for each event outcome represented in the chart based on the selected time frame and outcomes.
The legend describes the event outcomes. You can display all event outcomes or a selection of event outcomes to assist with your investigation and trend analysis. For instance, to display only Failure events, select Success and Challenge in the legend to exclude these outcomes.
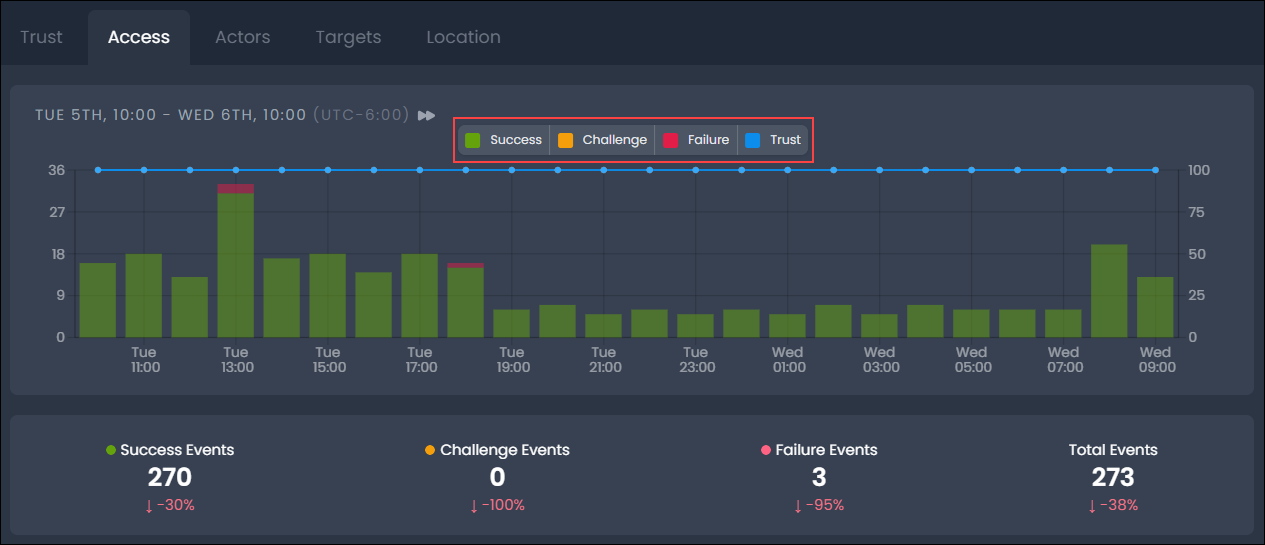
The outcome statistics display count and variance in percentage terms against the previous time period.
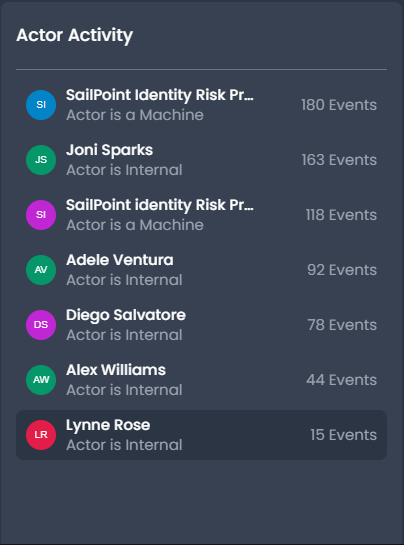
Actor Activity
The Actor Activity panel displays the top actors by event count. Tracking high activity levels and changes or spikes in activity across actors can reveal risk and potential malicious activity. The actor's object tags also indicate whether the actor is an internal or external user or machine. Users can select Load More... to view additional actors.
By selecting the actor to explore in the identity map and reviewing the actor profile, the access patterns, events and outcomes can quickly be assessed for potential threat behaviors.
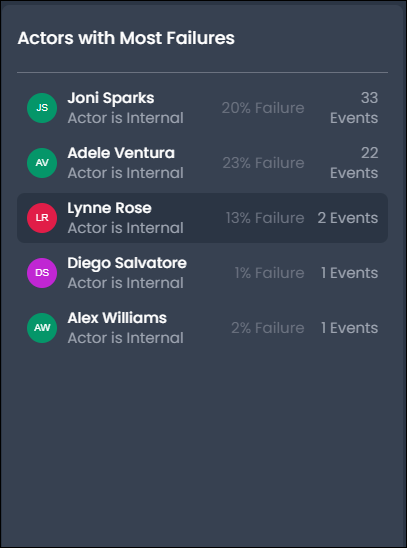
Actors with Most Failures
View actors with the highest failure outcome activity and the associated failure rate (a percentage of all activity) to identify potential security threats and operational issues, including problems like expired session credentials. Select an actor to explore and review their actor profile, access patterns, events, and outcomes for potential threat behaviors.
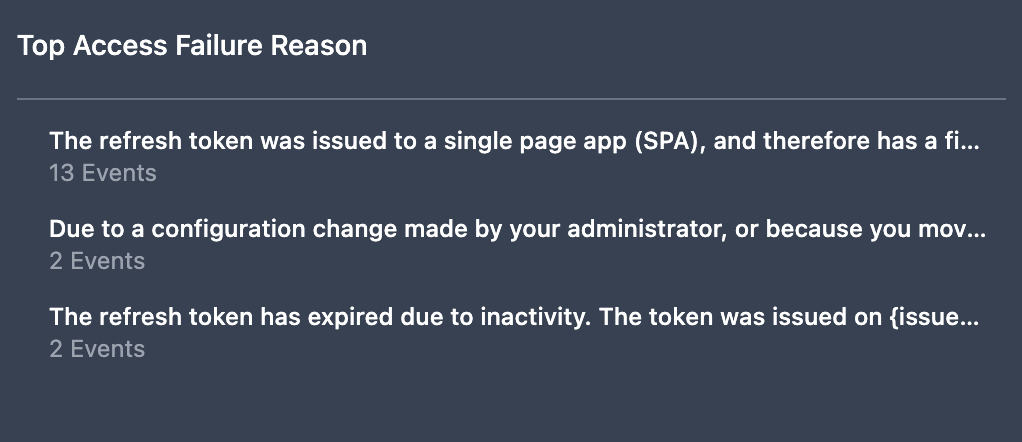
Top Access Failure Reasons
The Top Access Failure Reasons panel displays the top reasons reported for events with a failure outcome. Users can review these reasons to identify possible causes and the appropriate response or remediation.
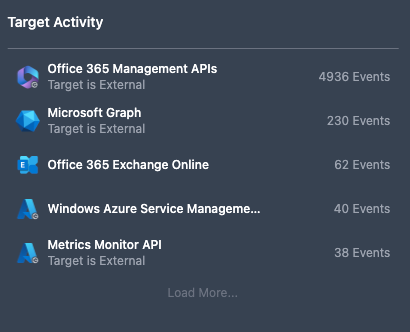
Target Activity
The Target Activity panel displays top targets by event count, allowing users to identify risk and potential malicious activity. To view additional targets, select Load More....
Actors Panel
The Actors panel provides an overview and timeline of actor-specific activity and highlights critical changes in actor status and lifecycle, such as recently discovered, dormant, and return-to-life statuses and lifecycles, to highlight potential risks for remediation.
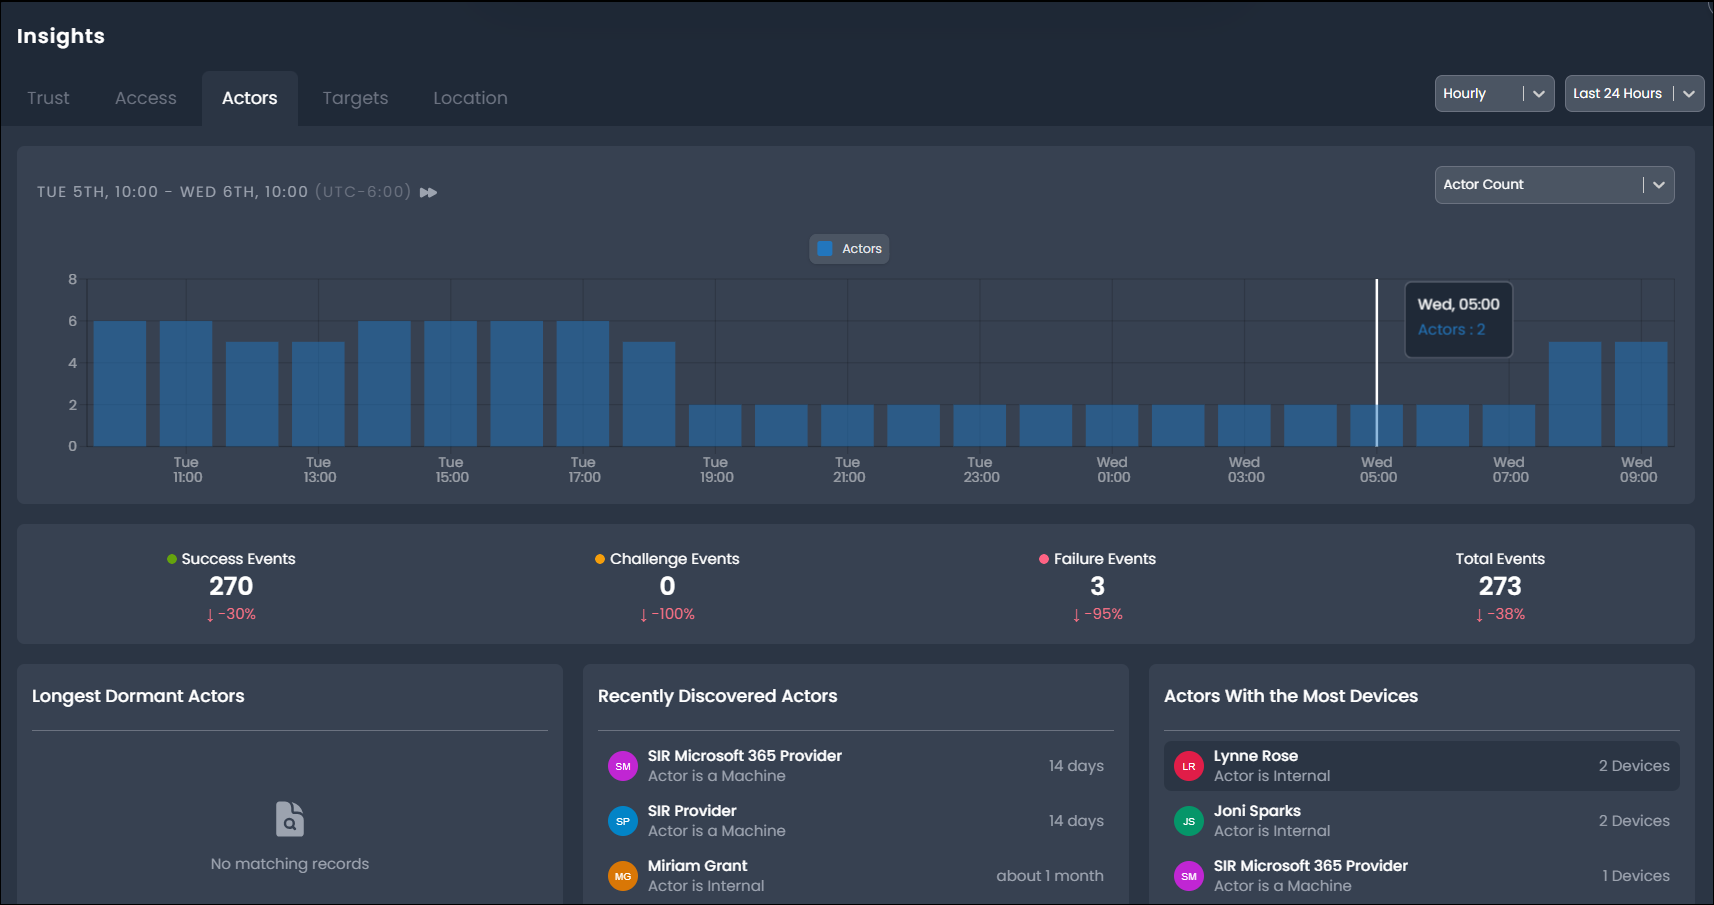
Actor Timeline
The Actor Timeline panel provides a chart of active actor count where an active actor has generated at least one event (of any outcome) during the associated time period.
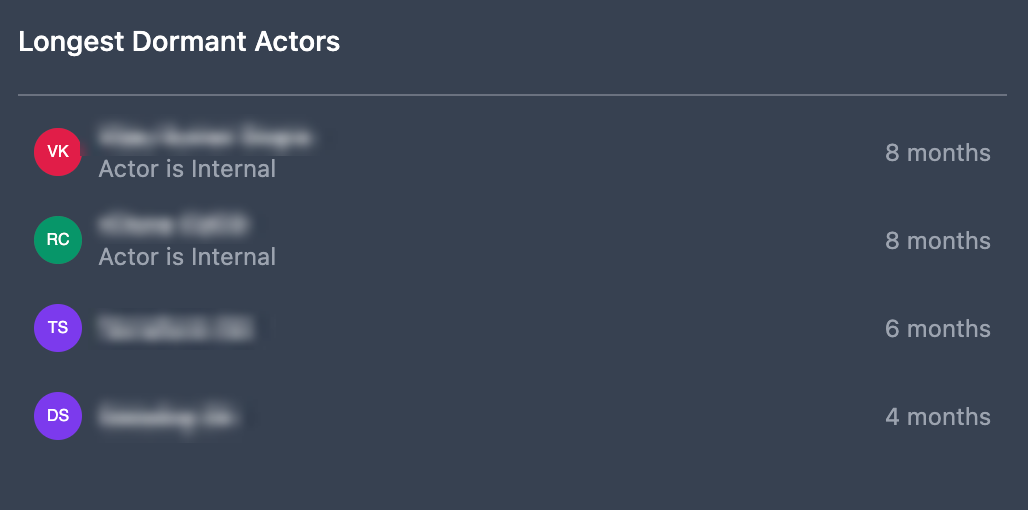
Longest Dormant Actors
The Longest Dormant Actors panel displays dormant actors, ordered by length of inactivity period. Dormant actors are active user accounts that have not reported activity for 30 days. As unusued, but active accounts with standing privilege, dormant actors represent greater risk of abuse by malicious actors.
Longest Dormant Actors displays dormant actors, ordered by length of inactivity period.
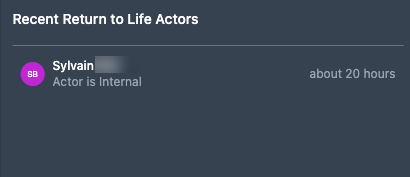
Recent Return to Life Actors
The Recent Return to Life Actors panel displays the most recent return-to-life transition events. Malicious actors may try to take over the accounts of actors who are returning to life after a dormant period. A dormant actor returns to life when Identity Risk reports the actor completed a successful event activity.
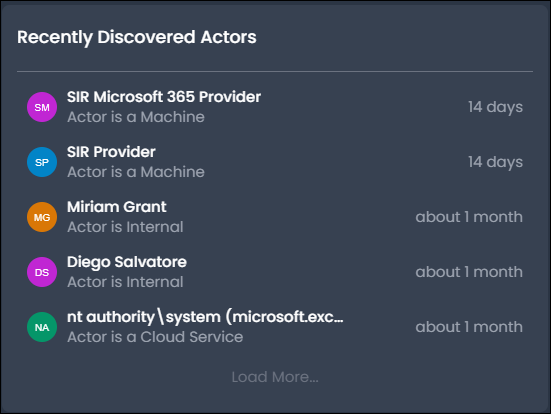
Recently Discovered Actors
The Recently Discovered Actors panel displays the most recently discovered actors along with the time since discovery. Actor discovery is based on the detection of activity for an actor object that has not been seen before. Newly-configured user accounts may be used as backdoor accounts in the event of a breach and should be monitored to detect unknown or unexpected actor presence.
Actors with Most Devices
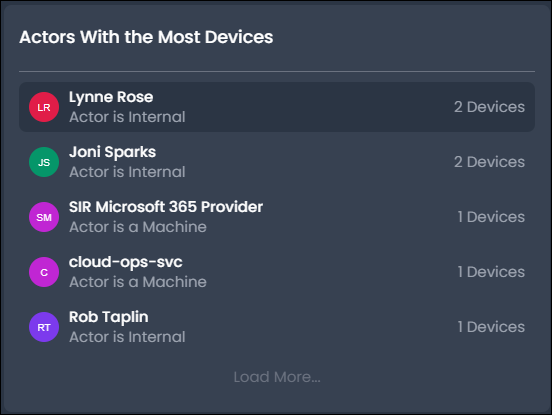
The Actors with the Most Devices panel lists actors and their device count, in descending order. Actors typically initiate access from a limited set of devices, depending on organizational policy. Actor activity reported from a higher number of devices may indicate malicious or high-risk activity.
Risk-Associated Actor Activity
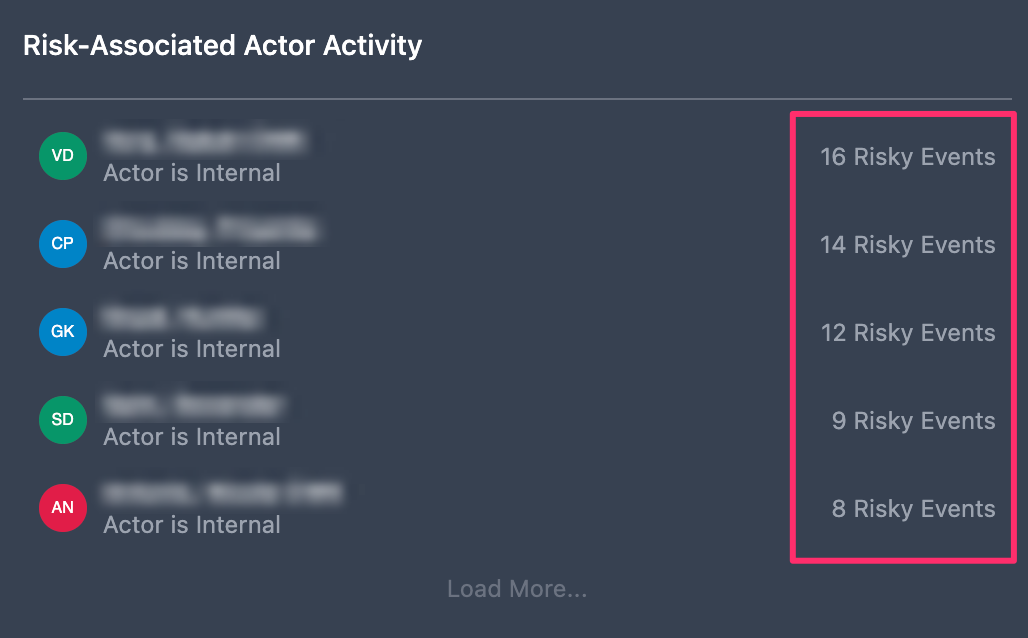
The Risk-Associated Actor Activity panel lists actors with reported risk activity from an external source in descending order. Identity providers, such as Microsft Entra ID and Okta, provide an external risk assessment and detection to create a risk score per user.
Targets Panel
The Targets panel provides an overview and timeline of target-specific activity and highlights critical changes in target status and lifecycle to highlight potential risks for remediation.
Target Timeline
The Target Timeline chart provides a visualization of the active target count, where an active target has generated at least one event (of any outcome) during the associated time period.
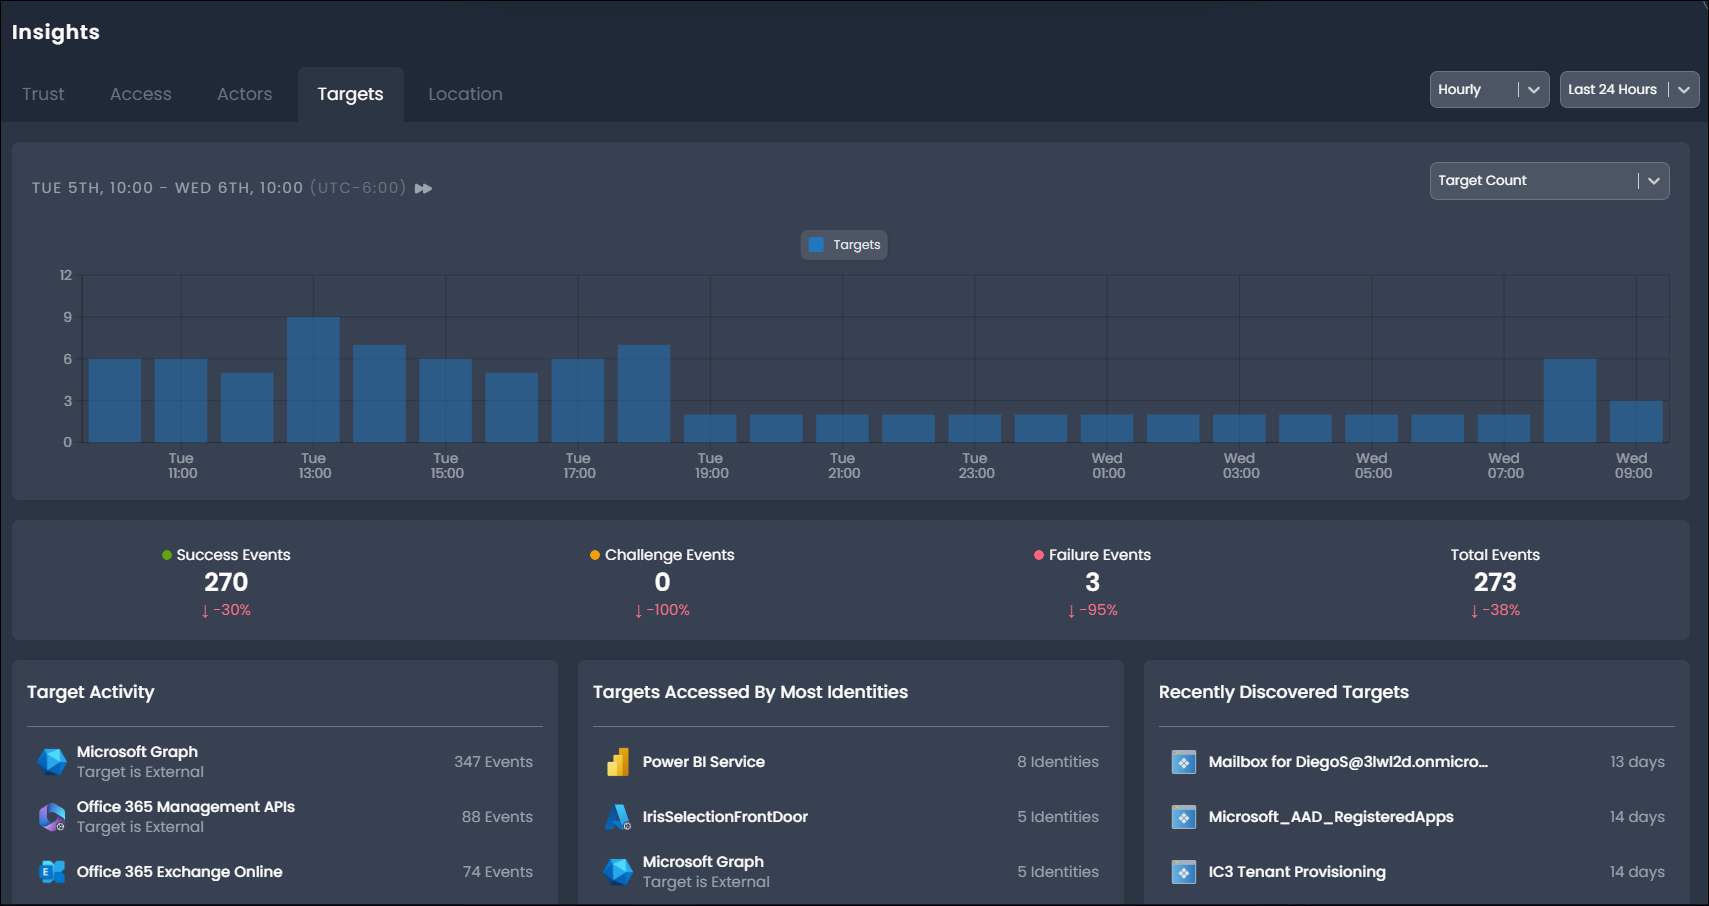
Target Activity
The Target Activity panel displays the top targets by event count to help users discover potential risk and malicious activity. To view additional targets, select Load More....
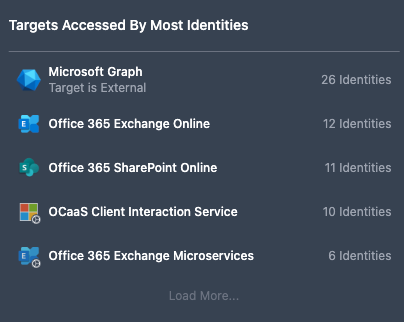
Targets Accessed by Most Identities
The Targets Accessed by Most Identities panel lists targets based on the number of identities active to the target, providing users with information on overall target usage.
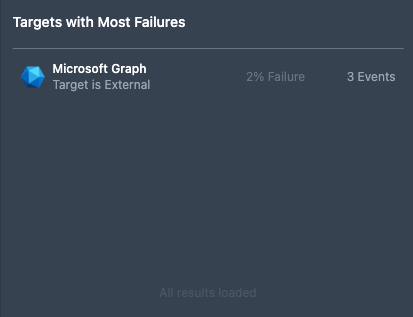
Targets with Most Failures
The Targets with Most Failures panel displays targets with the highest failure outcome activity and the associated failure rate (as a percentage of all activity). This information may help users identify potential security threats and operational issues.
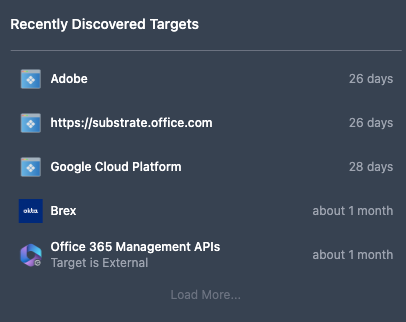
Recently Discovered Targets
The Recently Discovered Targets panel displays the most recent discoveries along with the times since discovery. Target discovery is based on the detection of activity for a target object that has not been seen before.
Risk-Associated Target Activity
The Risk-Associated Target Activity panel displays targets with reported risk activity from an external source, including the number of events marked as risky. Identity providers, such as Microsft Entra ID (aka Azure AD) and Okta, provide an external risk assessment and detection to create a risk score per user.
Location Panel
The Location panel provides a global map of activity source locations, identifying each location with a shaded grid to represent the density of activity. A global view of location access allows you to identify unexpected or undesirable access locations for further investigation and remediation.
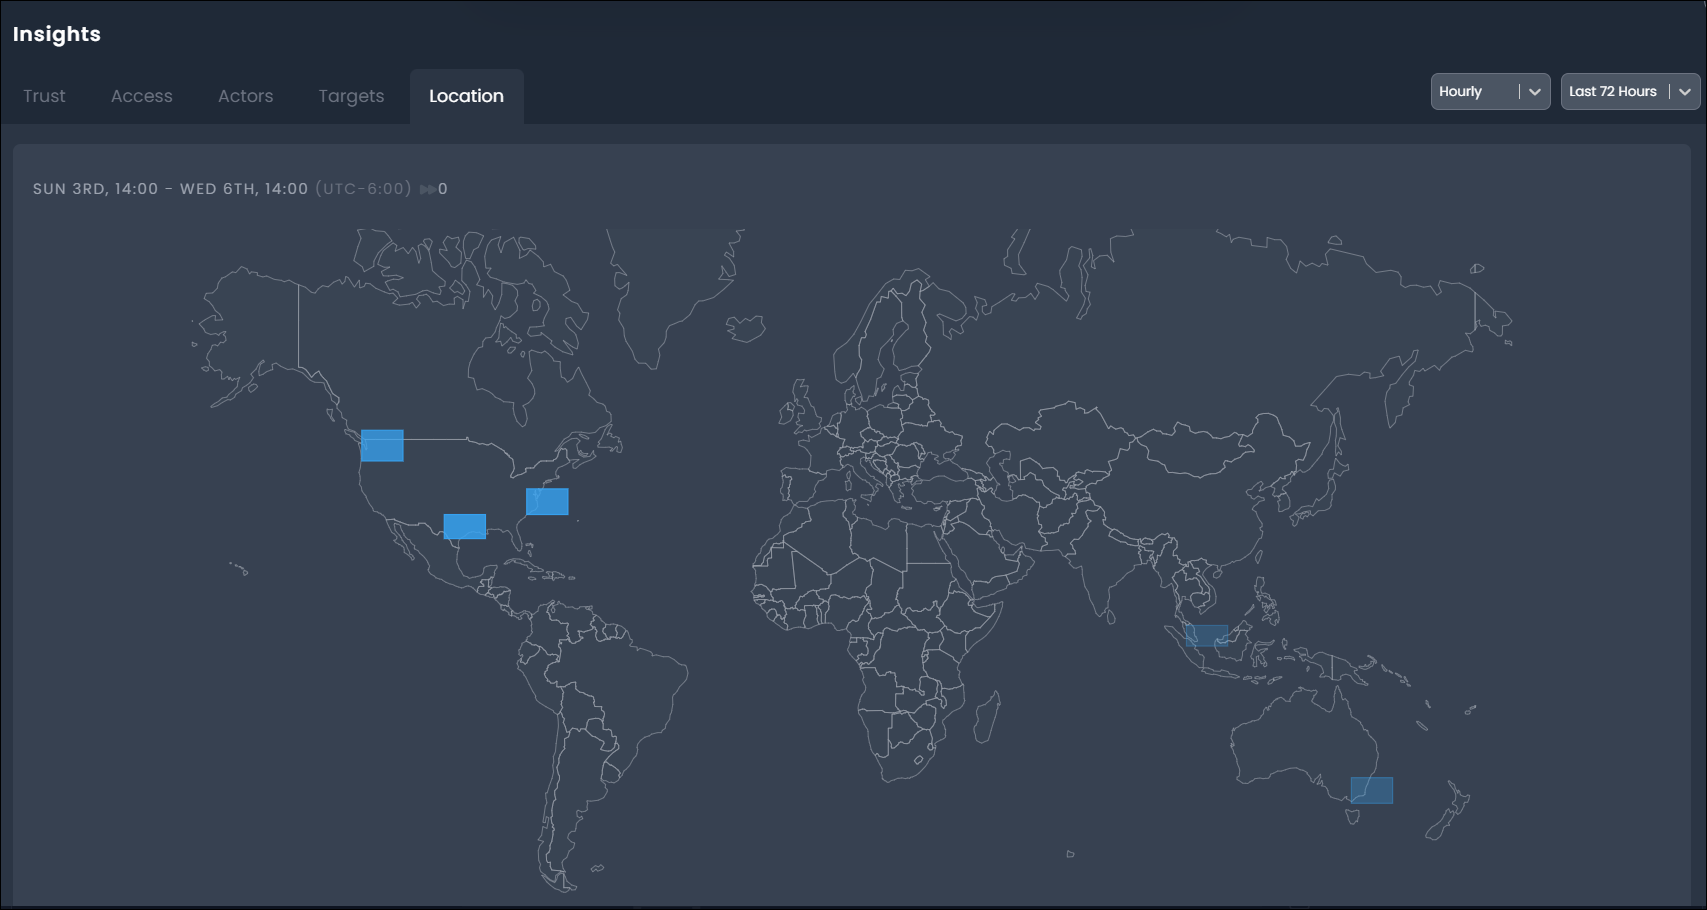
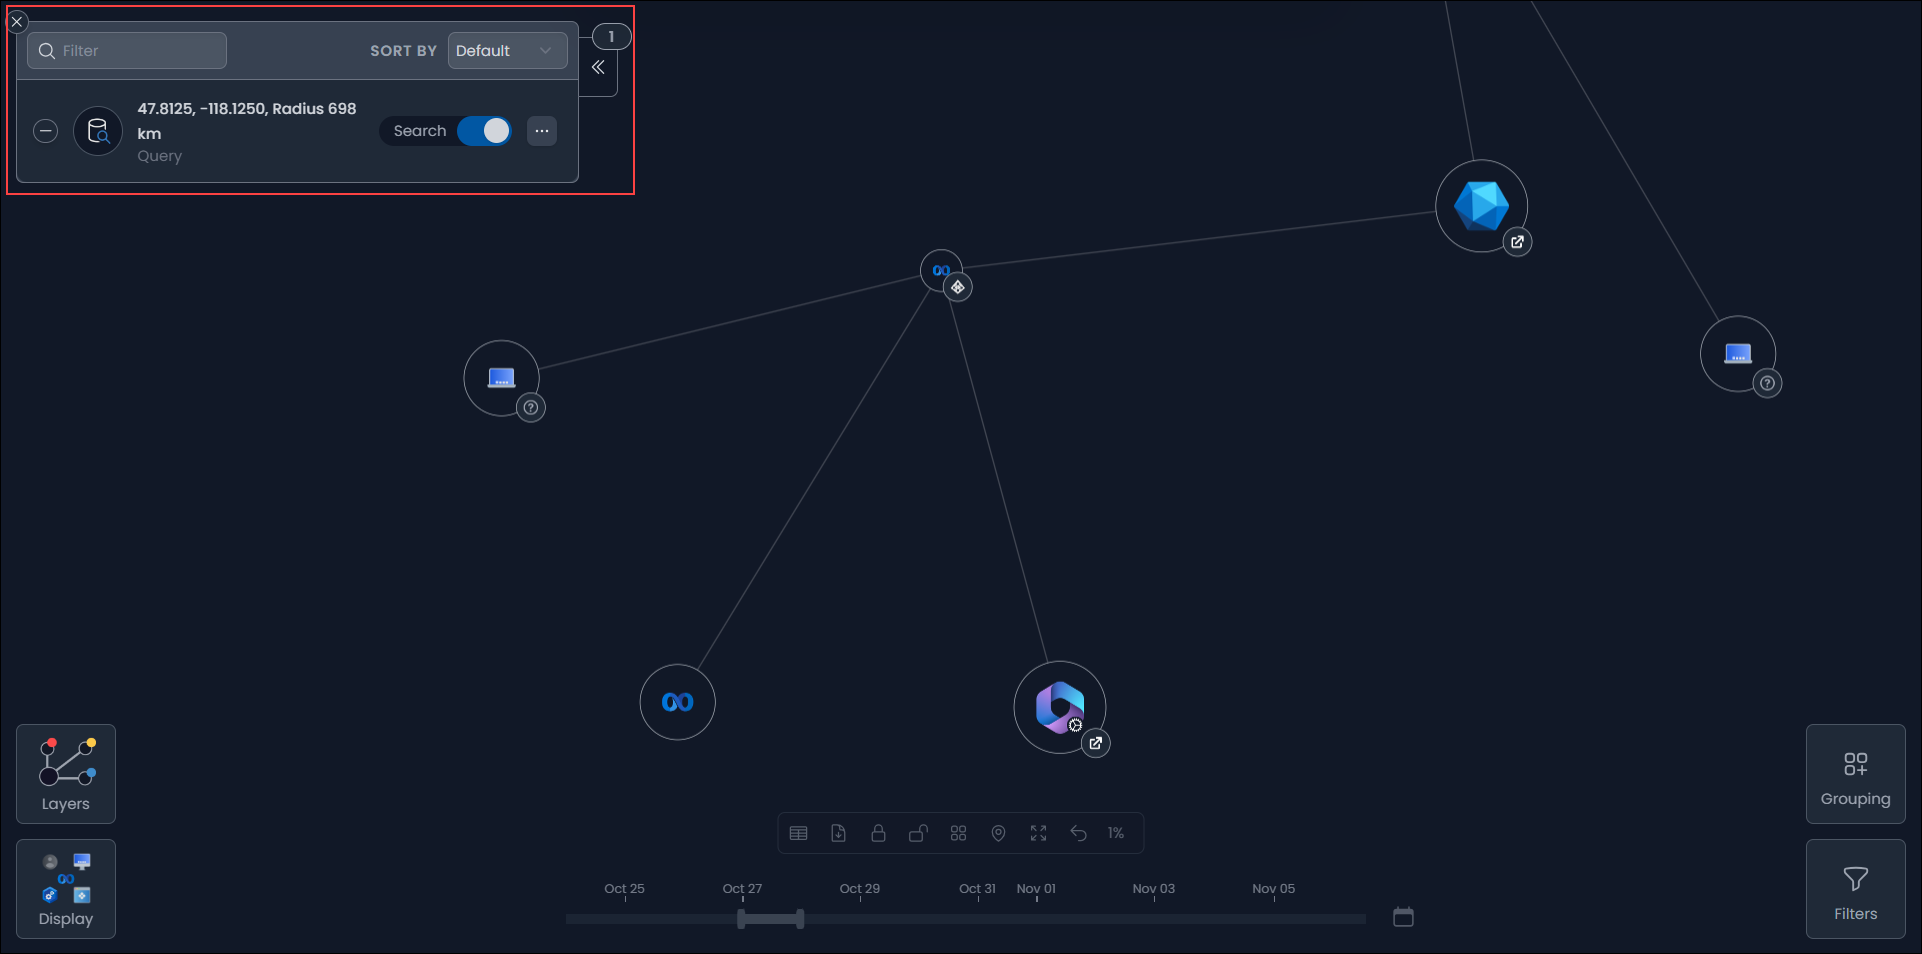
By selecting an access grid locations, you can add the location coordinates to the Identity Map Explorer to search the map for access generated from this location grid.
Using Insights and the Identity Map
From Insights, you can quickly and easily pivot to the the Identity Map for incident investigation. Select the target timeline and objects of interest to navigate to a visualization of every event. To investigate an actor or target from an insights panel, you can perform the following actions:
- Select an object to add it to the Identity Map Explorer. The object's profile also displays to provide you with further information on the object's activity and other related context.
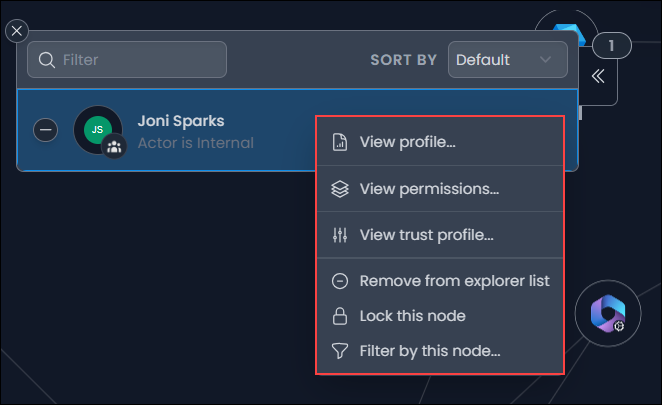
-
Right-click an object to view actions you can take, including options to display the object profile or add the object to the Explorer with or without search enabled.
You can also synchronize the Insights time selection with the Identity Map by selecting the time sync button next to the displayed time interval. This will adjust the map time selector to match the selected time interval to navigate access behaviors highlighted in Insights.
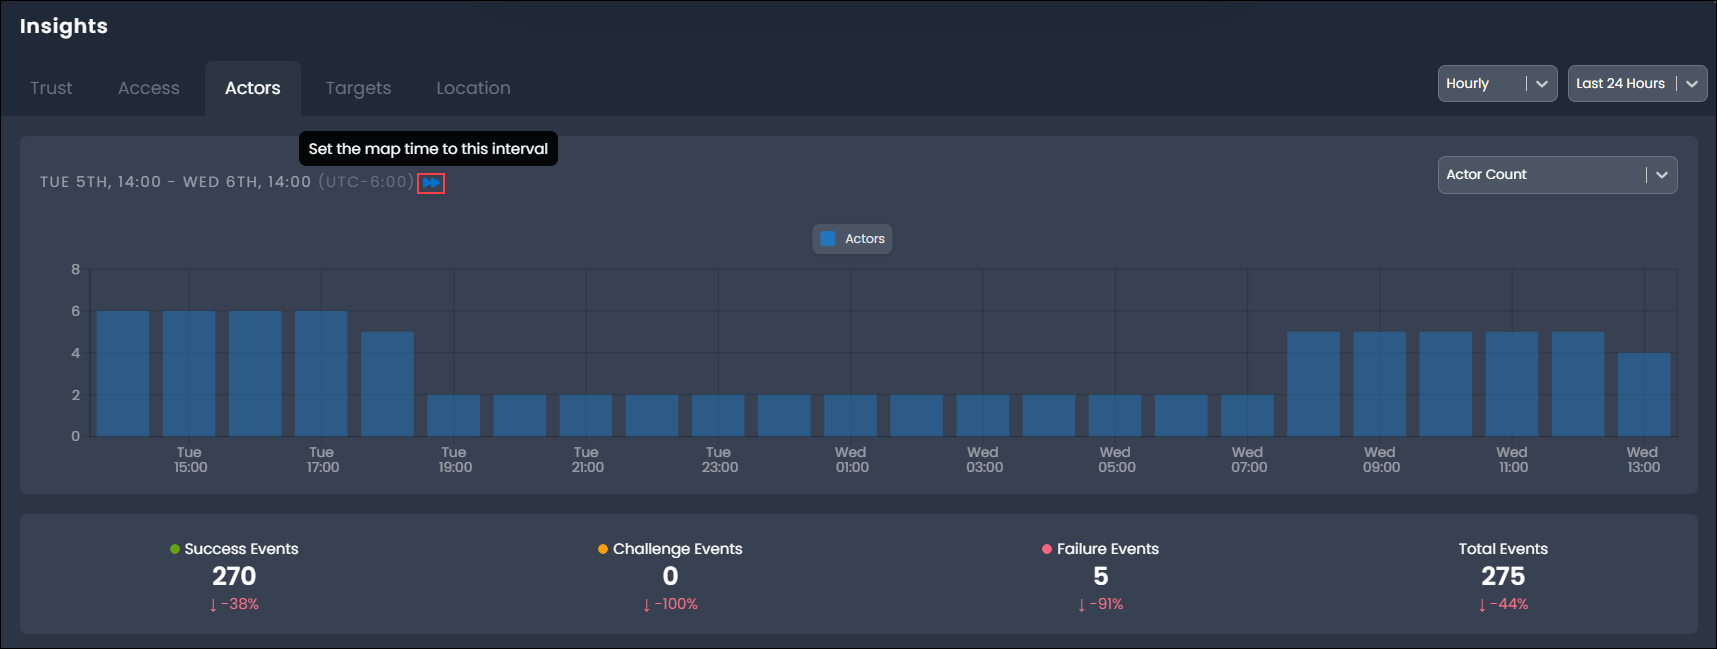
For example, if a one-hour time interval is showing a spike in access failures, the map time can be synchronized to that same hour. Any related actors or targets can be added to the explorer for search of their activity.
Exporting Data
Data represented in Insights may be downloaded in .csv format by selecting the Download Report or Download All Reports option. This will trigger the generation of a .zip file containing multiple .csv files, each representing component or panel data in tabular form.