Identity Map Overview
Use the Identity Map to visualize and explore identities and their behaviors across every device, application, and resource. Rich context is correlated with identity, policy, and access data to construct a converged view of identity and access across the organization and to provide the basis for trust.
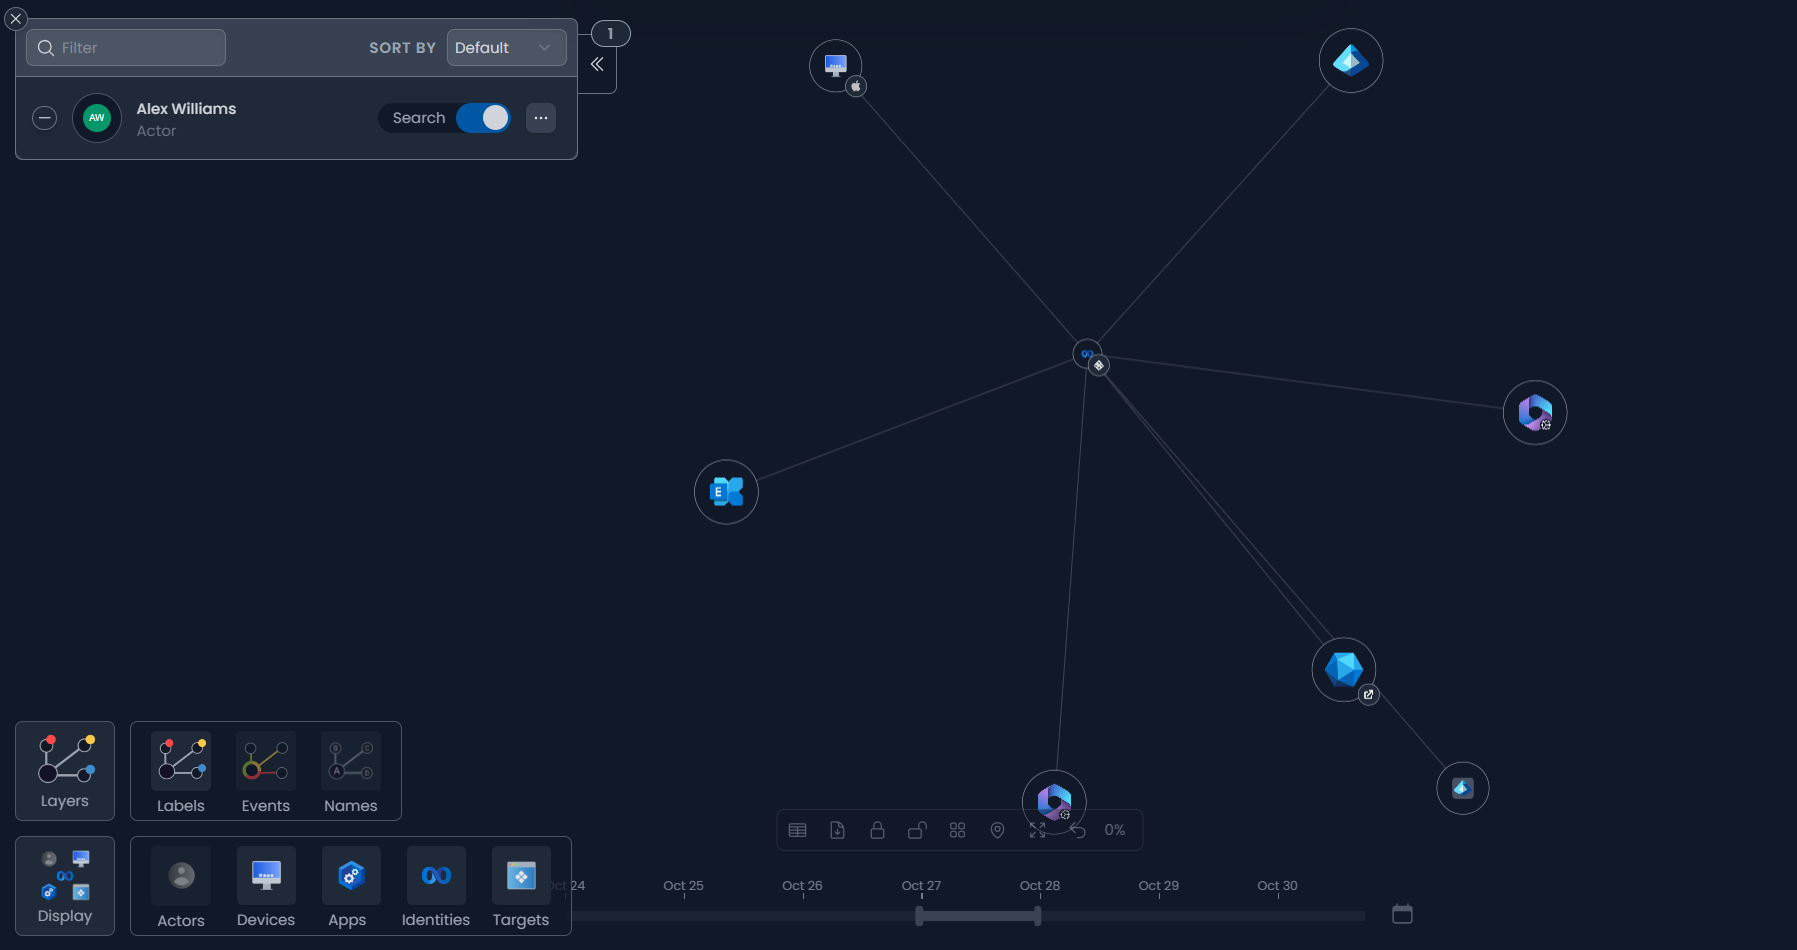
Understanding the Identity Map
The Identity Map offers a visualization of the relationships between the following objects:
- Actor - The human or machine user.
- Device - The device used for the access, such as a Microsoft Windows desktop, MacBook, or mobile device.
- Application - The application used on the actor's device, such as web browser or mobile app.
- Identity - A converged identity representing the access between the actor, device, application, and the target resource.
- Target - The resource being accessed, such as an application, site, file, or mailbox.
With the Events Layer enabled, the Access Events provide a visual indicator of proportional event status including Success (green), Challenge (orange), and Failure (red).
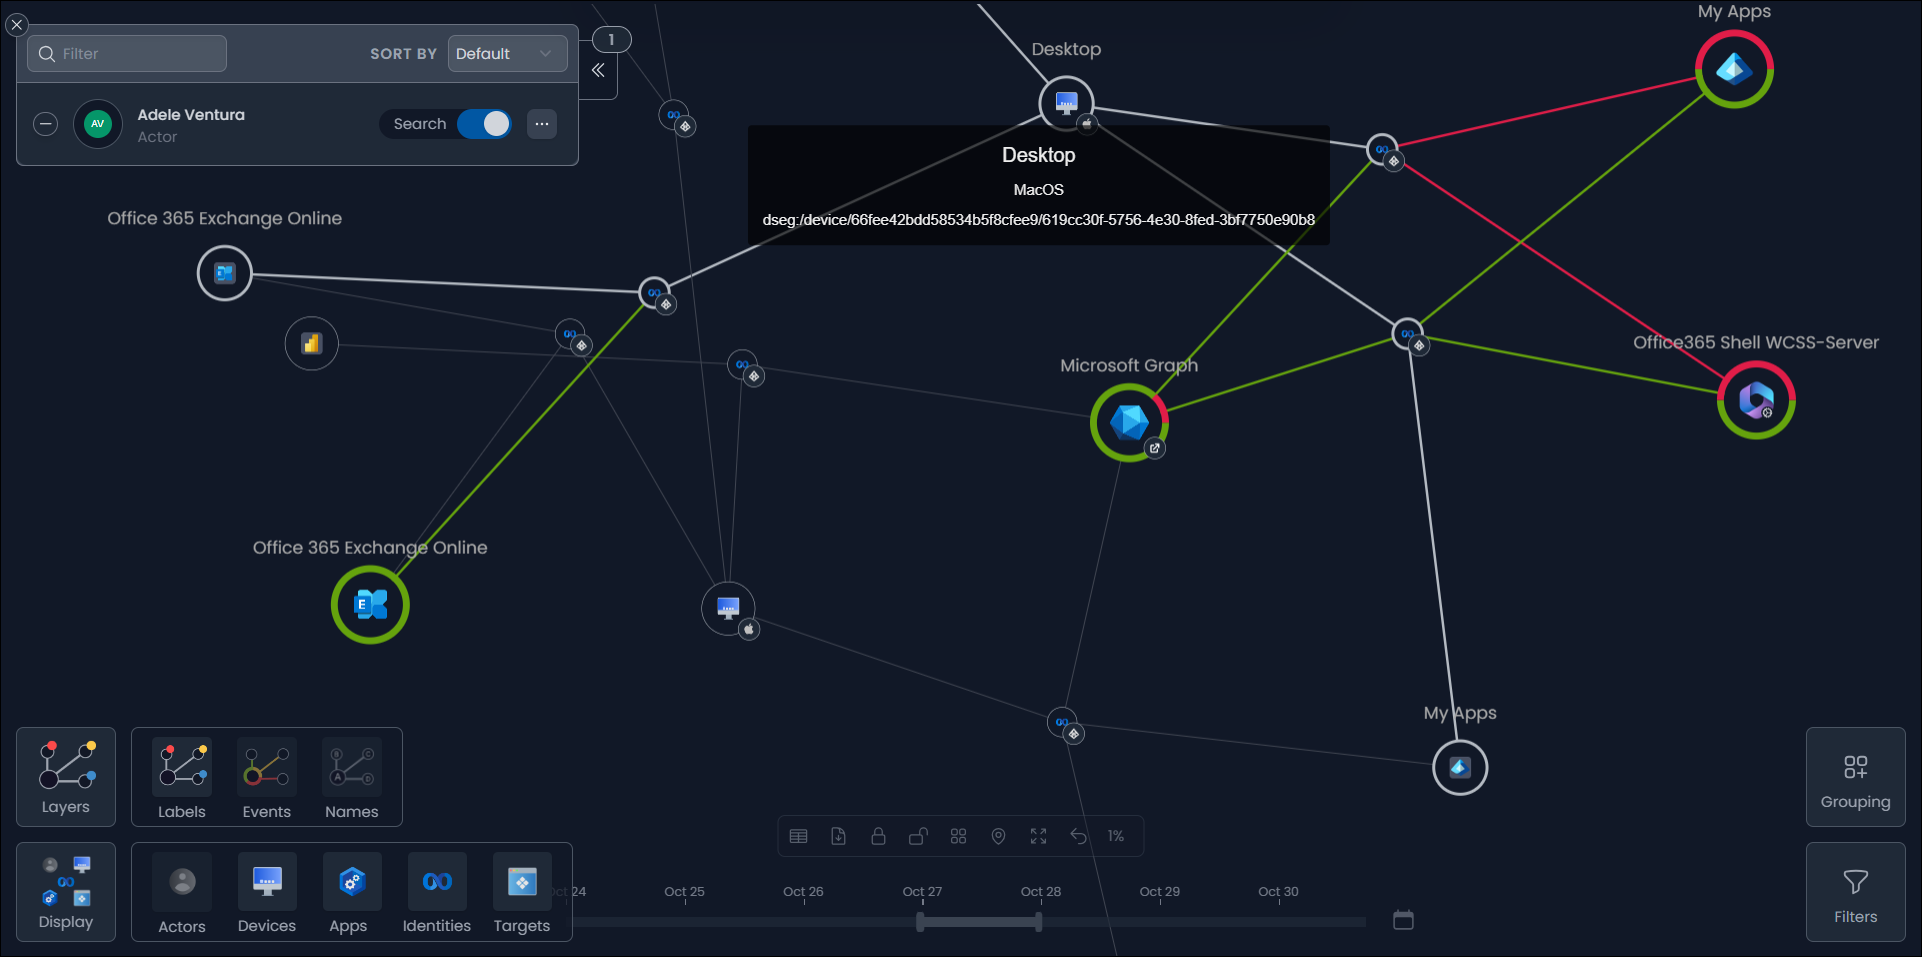
The colored ring around each target indicates the overall status of events for that target. Hovering your mouse over, or selecting an access event line (also known as edges), reveals the relevant data counts, statistics, and MFA status.
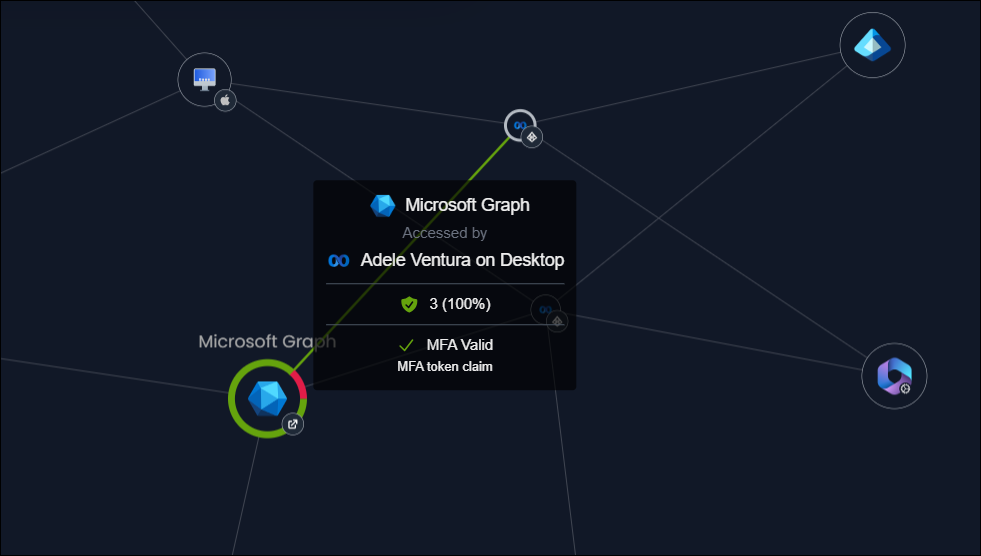
Specific event detail, such as event descriptions, can be found in the related Actor or Target profiles.
Interacting with the Identity Map
The Identity Map offers multiple ways to search, filter, refine, and discover relationships and activity. You can perform the following actions to access a specific data set in the Identity Map:
- Select an option in the Explorer to display its profile.
- Right-click an object to open a list of map functions, including filtering, locking or unlocking, and viewing profiles or permissions.
- Click and drag an object to relocate it on the map and lock it into place.
- Zoom in or out of the map by using the scroll wheel on a mouse.
- Select and drag the map to change the focal point.
- Filter the map by right-clicking a node and selecting Filter by this node... or by selecting the Filters button to open the Filter Criteria window. In this window, you can add, remove, and apply filters.
- Group objects in the map in the Grouping panel.
Keybindings are also available and can be found in the Keybindings section of the Settings window.
Using Controls in the Identity Map
Use the following controls to view current and historical activity in the Identity Map:
- Search Bar - View actors and targets by searching for attributes, including display name, location (city, country), email address, and job title. Discovered objects can then be searched for or filtered in the Identity Map or viewed in their actor or target profiles.
- Display Options - Refine the display of data in the Identity Map. Use layers to display different information such as labels, events, or names. Objects can be included or excluded by object type.
- Time Selector - Use the slider and date picker to display data for a set time period.
-
Groups and Filters - Group and filter options to refine the data in the Identity Map. Arrange objects by grouping them according to selected attribute or by applying a filter to reduce the objects displayed.
Note
Map controls may not be available until data has been ingested and processed.
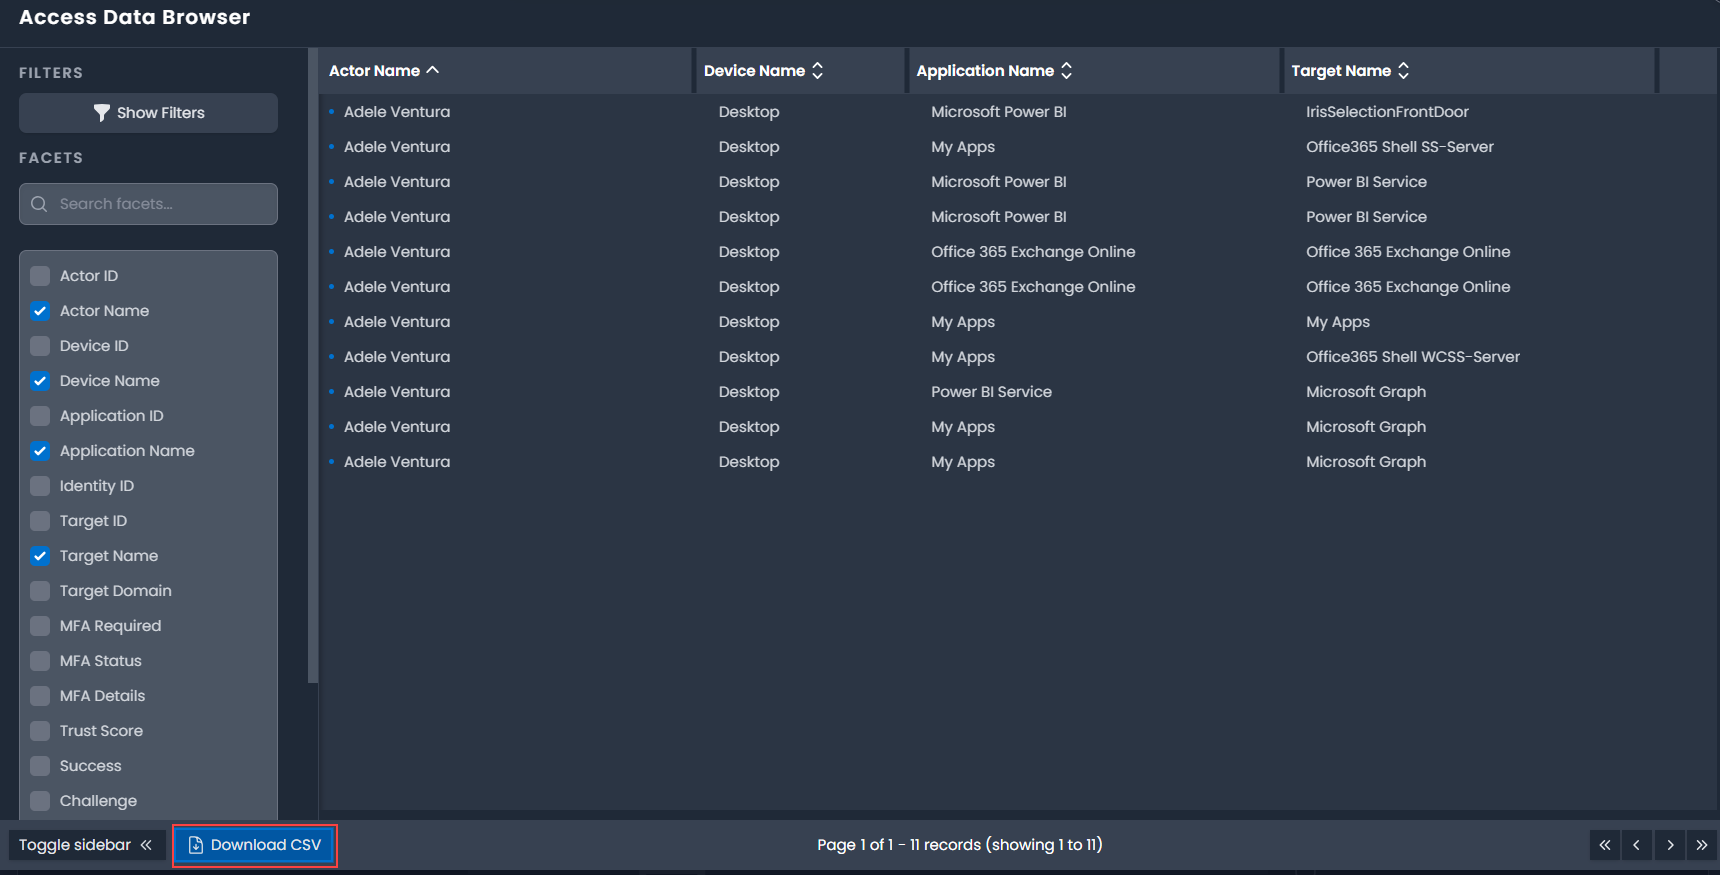
Accessing the Data Browser
The Access Data Browser offers an alternative view of the data in the Identity Map data in tabular form. In this view, you can further search, filter, or sort information.
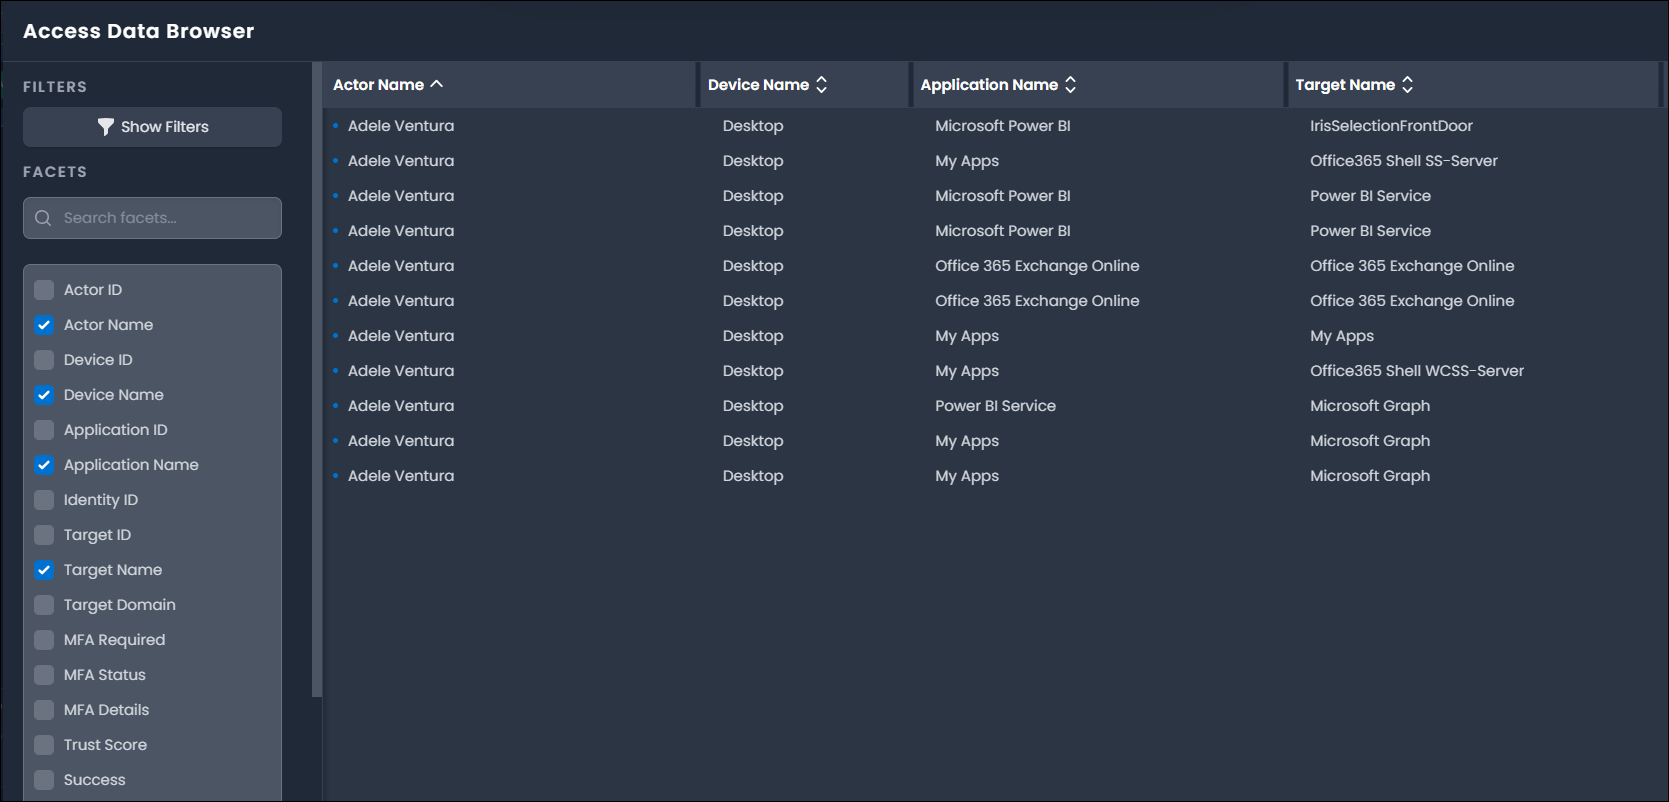
Select the Open Data Browser icon in the Map toolbar at the bottom of the Identity Map page to open the Access Data Browser.

You can select fields in the sidebar to add or remove data in the main panel. This data can be exported by selecting the Download CSV button.