Viewing Results as Graphs
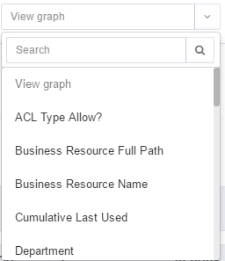
To the right of the Bulk Actions dropdown menu is a View Graph dropdown menu that provides various selections of graph views.
Graphs are a convenient way to view the results of filtering, and are available from the dropdown menu, immediately to the right of Bulk Actions. The graph groups filtered results per the selected field in the menu. There are as many chart views as there are fields.
To view filters as a graph, perform the following steps:
-
Click the View Graphs dropdown menu, and select a chart view. A bar chart view displays, with different colored columns and a key to the chart.
![]()
In Viewing Access Certifications, Department was selected as the chart view and separate bar charts display for Dept1, Dept2, and Null (No department).
Viewing Access Certifications shows a magnified view of the chart key for the chart in Viewing Access Certifications, in which different colors are used for tasks that are Pending (gray), Approved (dark green), Approved and Committed (light green), Rejected (dark red), and Rejected and Committed (light red).

-
Click a chart column.
A pop up screen displays an entire column (with the number of items in parentheses) or a portion of the column (with the number of items in parentheses). -
Click Pending for Action.
A dialog displays with the following options:-
Approve All
-
Reject All
-
Clear All
-
-
Click Approve All, Reject All, or Clear All. A Question Dialog displays, asking for confirmation, and providing space for a free text comment (only for Approve All or Reject All).
-
Click Yes to confirm, or click No to return to the previous screen.
-
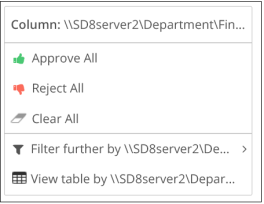
Alternatively, click Entire Column.
A dialog displays with the following options:-
Approve All
-
Reject All
-
Clear All
-
Filter further by (filtered item)–displays additional selected filtering
-
View table by (filtered item)–displays the table with the applied filters
-
-
Select Chart Filtered by (filtered item).
A dialog displays with field options for chart groups. -
Click a field for chart groups.
Note: After selecting a field, the chart displays, grouped by the new field and filtered by the selected value (in this case, Dept2). This is not a bulk action.