Administrator Tab
The Administrator tab of the Dashboard consists of the following widgets:
-
Data Ownership
-
Sensitive Data Exposure
-
System Health Check
-
Activity Statistics
-
Alerts in Last 7 Days
-
Active Data Classification Policies
-
Active Campaigns
-
Top Sensitive Resources by Activity
-
Top Users with Pending Tasks
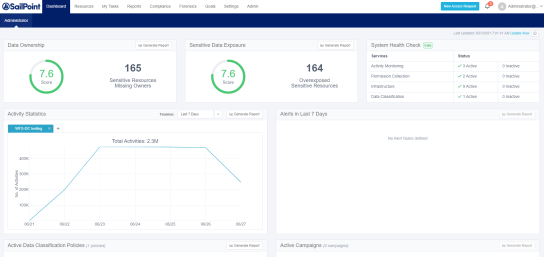
The administrator dashboard features a graphic overview to assist in monitoring the system. Its widgets show various system statistics for detailed analysis, including reports and drill-downs to forensics screens. You can update the widgets on the Administrator Dashboard either automatically (continuously or once a day, depending on the widget) or manually (when a user clicks the Update Now link).
When the Update Now task finishes, the system generates a Notification and displays it as a new unread notification that refreshes the Dashboard.
-
Click Update Now to update all widgets in the Administrator tab.
A task starts to update tables with information (in the background) for widgets, either automatically (daily) or manually. -
Click the bell icon to open the Most Recent notifications.
The Last Updated date to the left of the Update Now button changes accordingly.
The following subsections describe each of the Administrator Dashboard sections in detail.
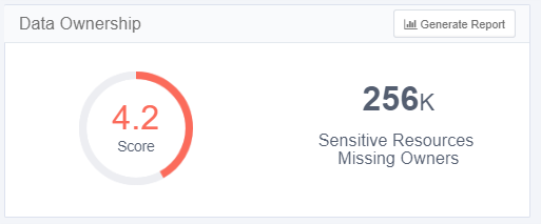
The Data Ownership widget displays the number of resources with classified data that are missing an assigned data owner (who must review and approve the access of users to resources). This widget displays the compliance score of each resource and is updated once a day (by default). Click Update Now to refresh the data.
The main portions of the Data Ownership widget are:
Generate Report
Click Generate Report in the widget to generate a report with a detailed list of resources. The system sends a notification (in the bell icon) when the report is ready, and you can access the report by navigating to Reports > My Reports.
Score
The score consists of a number and an associated color, as follows:
-
A score of 0 to 5 displays in red, and indicates a high risk
-
A score of 5.1 to 7.5 displays in yellow, and indicates a medium risk
-
A score of 7.6 to 10 displays in green, and indicates a low risk
Counter
The counter displays the number of sensitive resources missing owners.
-
If the number of resources is one thousand or more, it is expressed in K (for example, 10,000 displays as 10K).
-
If the number of resources is one million or more, it is expressed in M (for example, 10,000,000 displays as 10M).
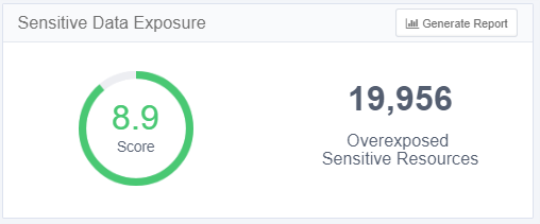
The Sensitive Data Exposure widget displays the number of resources (considered overexposed) with classified data that allow access to a large group of users. This widget (updated daily by default) also displays each resource’s compliance score.
To configure a resource as overexposed, navigate to Settings > General > Overexposed Resources, where you can view the current definition of overexposed resources and redefine overexposed resources, if required.
The main portions of the Sensitive Data Exposure widget are the same as the main portions of the Data Ownership widget, described in Data Ownership.
This widget displays the exposure of sensitive data, and is updated once a day (by default). Click Update Now to refresh the data.
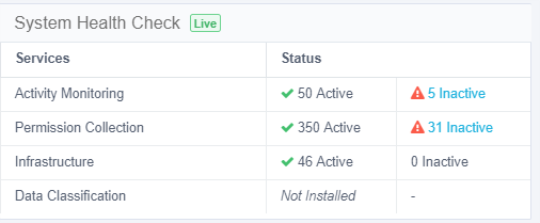
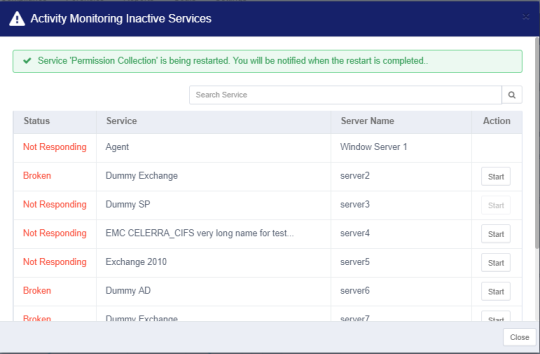
The System Health Check widget (which is live, and updated continuously) displays the status of system services. This widget displays a list of active and inactive services (by service and status), some of which may be restarted.
The widget displays services by category, and the status indicates the total number of active and inactive services, wherein an inactive service is one with a problem.
This widget is updated continuously.
To view a screen with a list of all inactive services and the reasons they are inactive, Click a blue Inactive link. An Inactive Services screen displays a table with the following columns:
-
Status (Not Responding, Broken)
-
Service (service name)
-
Server Name (name of the server on which the service resides)
-
Action (Start [Enabled], Start [Disabled], and empty (no screen action).
Click Start in a row on the table to start the service in that row.
Click Close to close the Activity Monitoring Inactive Services screen.
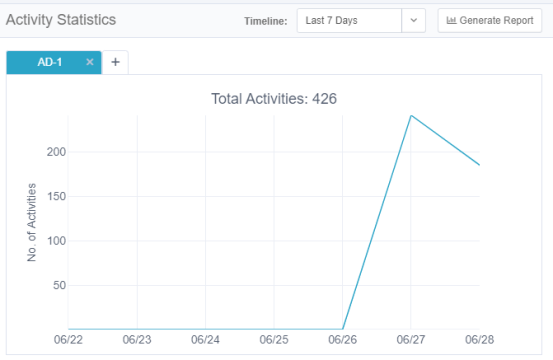
The Activity Statistics widget displays a trend graph of activities per application, with each tab representing a different application. Select the applications to monitor by adding tabs (by clicking on the + to the right of the tabs), or by removing tabs (by clicking on the x in the tab). The maximum number of tabs is five.
The main portions of the Activities Statistics widget are:
Timeline drop-down menu
(Last 24 Hours, Last 72 Hours, Last 7 Days, and Last 30 Days)
Generate Report tab
Data Ownership describes this tab.
Activity Statistics graph
-
Hover the mouse over any point on the graph to display a tool tip with information on the number of activities on a given date and time.
-
Click the graph to drill down to the activity forensics screen with a list of activities per resource. (You can also access this screen by navigating to
Resources > Activities.)
Click anywhere on the graph to display the associated activities in the forensics activities screen.
This widget is updated online. Reload the page to refresh the data.
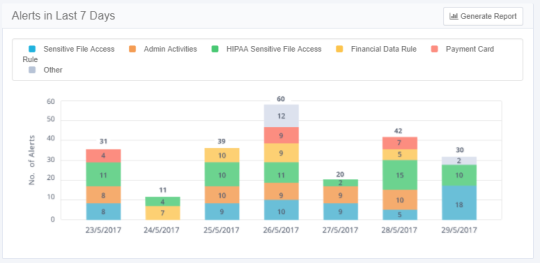
The Alerts in Last 7 Days widget displays the number of alerts created within the last seven days, particularly the five access rules with the most alerts (those with the top five access rules).
The main portions of the Alerts in Last 7 Days widget are:
Generate Report tab
Section Data Ownership describes this tab.
Alerts in Last 7 Days graph
Hover the mouse over any portion of a bar graph to display a tool tip with information on the number of alerts of a specific type, the alert date, and the group for whom the alert was issued.
Click a bar on the graph to display the list of classified resources in the selected application.
This widget is updated online. Reload the page to refresh the data.
The Active Data Classification Policies widget displays the active data classification policies in a separate graph for each policy. Each graph displays the five applications with the most policy-classified resources.
The main portions of the Activities Statistics widget are:
Number of Policies
The number is in parentheses after the widget name. Only one policy bar graph displays at a time. Click the arrows to the right or left of the graph to display graphs for other policies.
Generate Report
Section Data Ownership describes this tab.
-
Active Data Classification Policy graph
-
This graph shows the number of resources for each of the five top applications for a given policy.
Click a bar on the graph to display the list of classified resources in the selected application.
This widget is updated once a day (default). Click Update Now to refresh the data.
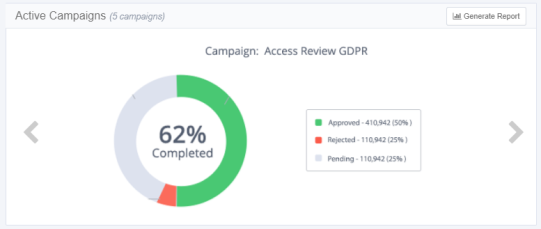
The Active Campaigns widget displays a graph showing the progress of active campaigns, with a separate screen for each campaign.
The main portions of the Active Campaigns widget are:
Number of Active/In Progress Campaigns
The number is in parentheses after the widget name. Only one campaign circle graph displays at a time. Click the arrows to the right (to display the next graph) or left (to display the previous graph) of the graph to display the graphs of other campaigns.
Generate Report
Section Data Ownership describes this tab.
-
Active Campaign graph
-
This circle graph shows the percentage of records for each active campaign, as well as the campaign status (approved is green, rejected is red, and pending is gray).
Click a bar in the graph to drill down to a screen with a list of pending records per reviewer in a selected campaign. (You can also display this screen by navigating to Compliance > Access Certification.)
This widget is updated once a day (default). Click Update Now to refresh the data.
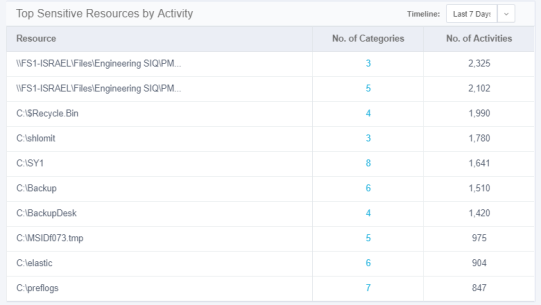
The Top Sensitive Resources widget displays a table of the sensitive resources with classified data, with the most activities within a selected time frame. The table includes columns for the number of categories and number of activities for each resource listed.
Click the mouse on the number of categories in a resource to display the names of the categories.
This widget is updated online. Reload the page to refresh the data.
The Top Users with Pending Tasks widget displays a table of File Access Manager users with the most pending tasks. Examples of tasks are access certifications and access requests.
The table includes columns for the name of the user, the number of the user’s pending tasks, and a button to send a reminder to the user
Click the Send Reminder icon in the row of the user to send the user a reminder of the tasks still pending.
The following alert displays: “Email reminder to [User FullName] is being sent. Notification will be provided upon completion.”
This widget is updated once a day (default). Click Update Now to refresh the data.
