Checking the System Health
The Health Center provided in the administrative console displays a list of all File Access Manager services.
File Access Manager is a distributed system with components in multiple locations. Each tab in the service status display represents the service types, arranged by subject. The panel is split into two tabs, one for Production services and one for Disaster Recovery services. If the system does not have a disaster recovery environment configured, the Disaster Recovery tab is disabled.
The spotlight on each service represents its status as follows:
Green
Service is in good health.
Yellow
Warning that the service needs a checkup.
Red
Service is in poor health.
Gray
Service exists, but is not installed.
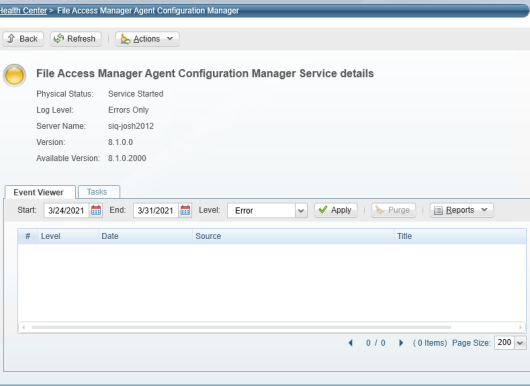
To display a service’s health status in the Administrative Client, navigate to Health Center and select a service.
The following information displays:
Physical Status
Service started, stopped, or starting.
The Watchdog Service operates the physical statuses.
Log Level
Current (running value) log level–DEBUG/INFO/ERROR.
Server Name
The server on which the service is running.
Version
The File Access Manager version that is running, as well as any pending versions.
-
Select Refresh to refresh the service health status.
-
Select Actions to perform one of the following actions on this service:
-
Change log level
-
It is not necessary to restart the service to change the log level
-
Changing the log level through the administrative client creates a task for a specific service to handle and changes the log level in runtime
-
By default if you restart the service, the log level will revert to the original Error state until the next service restarts
-
-
Restart service
-
Start service
-
Stop service
-
The File Access Manager Watchdog service performs the start, stop, and restart service actions. If you stop the Watchdog service, there are no stop, start, or restart service actions for services on that server.
Note: It is not possible to stop, start, restart, or change the log levels of applications from the Health Center. You must perform a manual log collection, start, stop, or restart on the Watchdog service or any service with installed applications.
Gathering system logs
To gather system logs, navigate to the Administrative Client's Health Center. Select Actions and then select Gather System Logs, which is the only action available.
The system creates a task to handle log collection from the physical servers with File Access Manager installed. The task gathers all the logs, compresses them into a zipped file, and sends the link to the user. You can view the logs for each physical server on the Reports page of the File Access Manager web application.
Viewing Health Center events
-
Select the Event Viewer tab to view events on the selected service.
-
Select a start date and an end date by clicking on the calendars next to the Start and End fields.
-
Select a level from the Level Field dropdown menu–Information, Error, Warning, or All.
-
Select Apply to apply the date and level filters.
-
Select Reports and navigate to Reports > Applied Filter Events > Produce Now to produce reports based on the selected service.
Viewing Health Center tasks
-
Select the Tasks tab to see a list of tasks related to the select service.
-
Check the Show Tasks from all users checkbox to show tasks related to the selected service from all users.
-
Select Refresh to refresh the list of tasks.
-
Select Clear All to clear the entire list of tasks.